How to Show the Baseline Critical Path In P6

All project controls professionals know how critical is it to monitor our project’s critical path. And we all know that comparing our project performance to a baseline is also essential. Most of us are doing this critical path and baseline monitoring in Primavera P6 every day. But what about monitoring our project’s critical path vs our baseline critical path in P6?
Of course, as we execute a P6 schedule, over time, the schedule will diverge from it’s baseline. The myriad of changes, out-of-sequence fixes, late or early work will be inevitable. And it will happen that those changes will also affect our original critical path.
Are we able to check our path and compare it to the baseline critical path in P6?
The answer is Yes.
Although comparing 2 projects usually involves a tool like Claim Digger or Change Inspector, it’s possible to do a visual comparison of current project vs the baseline using the P6 Gantt chart. But here are the steps needed to let you compare your critical path to your baseline’s critical path.
Displaying the Baseline Critical Path In P6
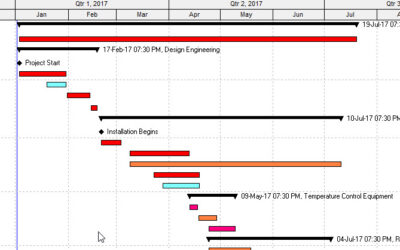
Let’s start by assuming we have a well-built project schedule that has not yet started. We have created a baseline and assigned it as a project baseline in P6.

In the Gantt chart shown above, the thicker bars represent the current project schedule while the slimmer bars below the thicker bars are for the baseline schedule. The thick red bars show the critical activities in the current schedule. It is possible to display baseline bars in red to highlight the baseline critical path activities.
Step 1 – Setting a Baseline Filter
Before we set the bars, let’s set-up a filter which we will use to reference the baseline total float. The filter, called Baseline Critical has the settings BL Total Float is less than or equals 0d. (NOTE: You must have a Project Baseline assigned to your project in order to be able to pick the field BL Project Total Float. Otherwise, this field is not available.)
Click OK to save the Filter and exit the Filter window. We will need this filter for later.

Step 2 – Add a Bar to the Gantt Chart settings
In order to display the baseline critical path in P6, we’ll start with the default “Classic WBS Layout” is an Activity Layout that ships with P6. It’s already set up to display current critical activities. I recommend you can save a copy of this Layout as we will make changes to it. (PS: Don’t forget these must-have layouts for everyday P6 excellence.)
Once done, from the P6 menu, click on Views >> Bars to open the Bars dialog box.

Click on the Add button and this will add a new row of bar option as shown below.

Under the Name column of the Bars dialog and in the newly created row, double-click and type the name Baseline Critical as shown below.

On the new Baseline Critical row and under the Timescale column, select Project Baseline Bar from the dropdown menu as shown below. This step makes sure the bar pull data from the project baseline that set for your project.


Step 3 – Setting A Filter for the Baseline Critical Path Bar
We’re getting closer to displaying the baseline critical path in P6. On the new Baseline Critical row and under the column Filter, click the words All Activities and this will open a new Filters dialog.

Ensure that All selected filters is selected under the Show activities that match option (arrow 1) and the Replace activities shown in current layout is selected under When applying the selected filters(s): (arrow 2). Tick the Baseline Critical filter we created earlier (arrow 3). Now, click on the Apply button (arrow 4) and then OK button (arrow 5) to close the Filter dialog.

Step 4 – Setting the Bar Style
Still with the new Baseline Critical row selected, under the Bar Style (see image below), change the Shape to a slimmer bar (arrow 1); change Color to red (arrow 2) and then change Row to 2 (arrow 3). A look at the Preview column will show a slimmer red bar for our new Baseline Critical row (arrow 4).

Now click Apply and then OK in the Bars dialog to return to our Gantt chart. Let’s check the results.

We can now clearly see that some of the baseline bars are showing red. Those red bars are displaying the baseline’s critical path.
Baseline Critical Path in P6 : Doing a Visual Comparison
Our Gantt chart does not show any changes from the original Gantt chart we started with in the first image of this post and that is because the our current schedule in this example has not changed from the baseline schedule.
Therefore, assuming that after further review, the project team has decided to revise some activities duration thereby changing the current schedule’s critical path. The Gantt chart below shows how this new critical path differs from the baseline critical path in P6.

Doing a visual scan of the current & baseline bars, our current critical path is now showing much different from the baseline critical path. The result is very useful. As we work in our schedule, we can now monitor whether changes we make are triggering a change in our critical path as compared to our baseline critical path.
Conclusion
It’s not easy to notice when the changes you make to a schedule are altering your project’s critical path. It can sometimes catch you off-guard. As you become really familiar with a schedule, you’ll know where the project’s critical path lies; you’ll know that it runs through phase 1, area c and then through coat pipelines. You’ll just know because you’ve stared at the project for so long.
But you shouldn’t have to rely on your memory.
This method seems to be the easiest and most reliable way to show the baseline critical path in P6; right in P6 and not by exporting and running a comparison in some other tool.
I hope you find this post useful and if you’ve come up with another method of comparing baseline & current critical paths, please share it with us.