
Microsoft Project is a cornerstone tool for project managers, offering a robust suite of features to plan, track, and execute projects with precision. Among its many capabilities, five features stand out for their utility and uniqueness, enabling users to streamline workflows, enhance reporting, and maintain consistency across projects.
1. Copy & Paste Activities from Excel
Overview
One of the most practical features in Microsoft Project is the ability to copy task lists from Microsoft Excel (or other Office programs like Word or PowerPoint) and paste them directly into your project plan while preserving formatting. This includes retaining fonts, colors, and the hierarchical outline structure of the tasks.
How It Works
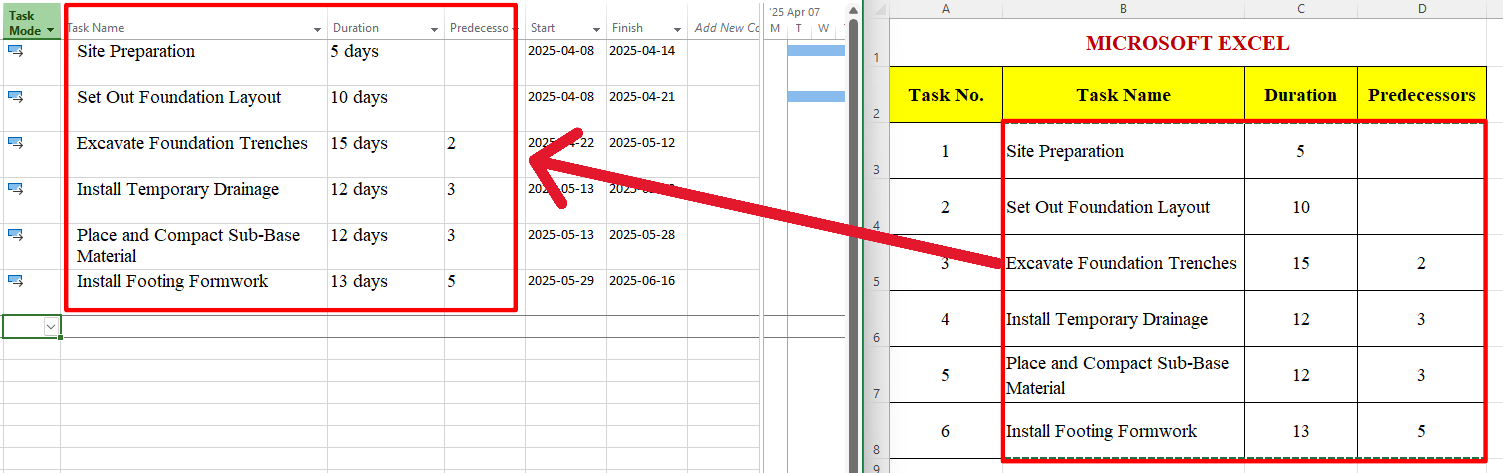
To use this feature, select a task list in Excel, ensuring it uses bullets or tabs to indicate task relationships (e.g., subtasks). Copy the list using Ctrl+C, then open Microsoft Project, create a new project (File > New > New Project), select the first row in the Task Name column, and paste the list using Ctrl+V. The tasks will appear in Project with the same formatting as in Excel, including colors, fonts, and indentation levels.
Example
Imagine you have an Excel spreadsheet with a task list for a construction project, where tasks for different phases (e.g., foundation, framing, finishing) are color-coded. Copying this list into Microsoft Project ensures that the colors and structure remain intact, making it easier to visualize the project hierarchy from the start.
2. Custom Fields with Formulas (Planned % Complete & Actual % Complete)
Overview
Microsoft Project allows users to create custom fields with formulas to calculate specific values, such as planned % complete and actual % complete. While the actual % complete is a standard field in Project, planned % complete is not built-in but can be calculated using a custom field, enabling you to compare planned progress against actual progress.
How It Works
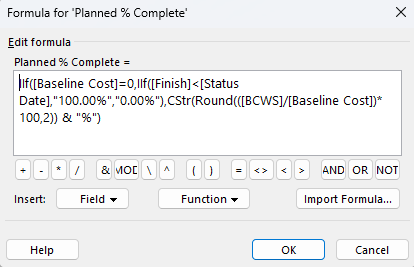
To create a custom field for planned % complete, go to the Project tab, select Custom Fields, and choose a field type (e.g., Text). IIf([Baseline Cost]=0,IIf([Finish]<[Status Date],”100.00%”,”0.00%”),CStr(Round(([BCWS]/[Baseline Cost])*100,2)) & “%”) This formula calculates the percentage of a task that should be complete based on the baseline start and finish dates relative to the current date.
Example
In a construction project, you might create a custom field to calculate planned % complete for various task based on their baseline duration. Comparing this to the actual % complete entered by developers helps you identify tasks that are falling behind schedule.

3. Conditional Formatting with Graphical Indicators
Overview
Microsoft Project does not offer conditional formatting in the same way as Excel, but you can achieve similar visual effects using custom fields with formulas and graphical indicators. These indicators, such as colored dots or icons, visually represent task conditions, making it easier to assess project status at a glance.
How It Works
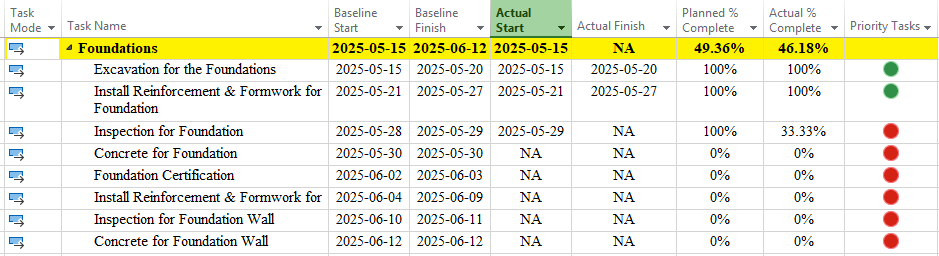
To implement this, create a custom field (e.g., Project > Custom Fields > Text or Number). Define a formula to evaluate a condition, such as whether a task is on schedule or delayed. Then, in the Custom Fields dialog, click Graphical Indicators and set criteria, such as: – Green dot for tasks where actual % complete matches or exceeds planned % complete. – Yellow dot for tasks at risk (e.g., slightly behind schedule). – Red dot for tasks that are significantly delayed. Once set, these indicators appear next to tasks in the Gantt Chart or Task Sheet view.
Example
For a construction project, you could use graphical indicators to flag tasks based on their status. A green dot might indicate that foundation work is on track, while a red dot could highlight delays in roofing, prompting immediate attention.
4. Export to Excel for Visual Reports
Overview
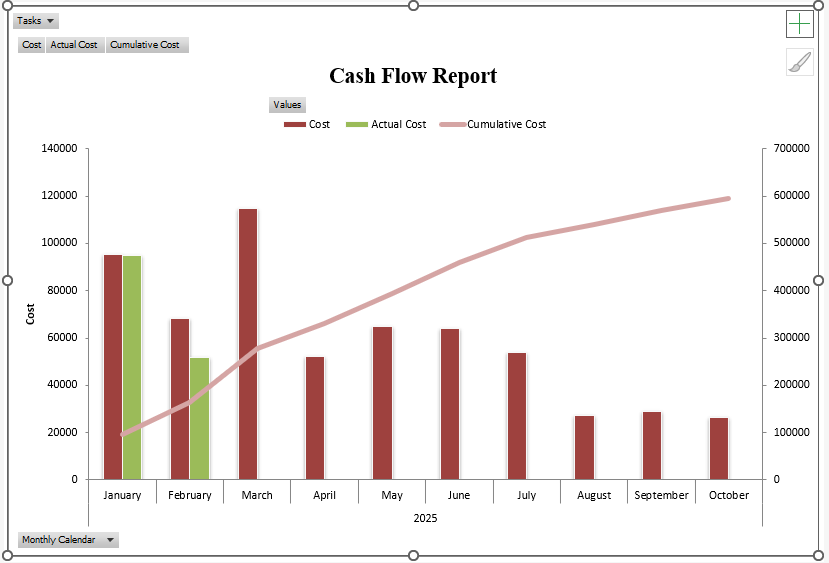
Microsoft Project’s Visual Reports feature allows you to export project data to Excel, where you can create dynamic reports using PivotTables, PivotCharts, and other Excel tools. This is ideal for in-depth data analysis and creating visually appealing reports for stakeholders.
How It Works
To export data, go to Report > Visual Reports, which helps in exporting pre-built cashflows report to Excel for better use and modification.
Example
For the cashflow of a project, you could export task data to Excel to create a PivotChart showing the cash distribution against time.
5. Organizer for Managing Global Templates
Overview
The Organizer in Microsoft Project is a powerful tool for managing and sharing project elements, such as custom fields, views, tables, and calendars. By copying custom fields to the global template (Global.mpt), you can make them available in all new projects, ensuring consistency and saving time.
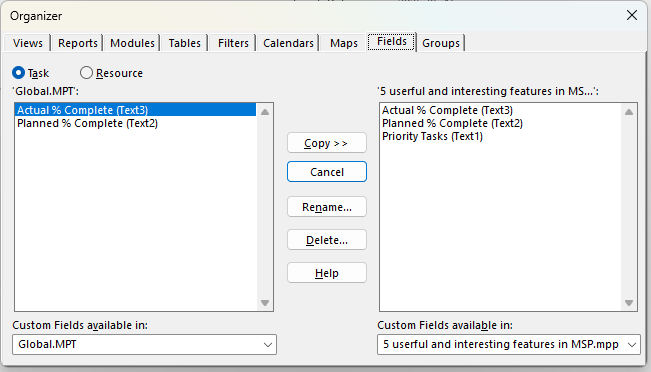
How It Works
Access the Organizer via File > Organizer (or File > Info > Organizer in newer versions). Select the custom field you want to save, choose the source project, and copy it to the Global.mpt template. Example
In a consulting firm, you might create a custom field for “Client Priority Level” and save it to the global template. This ensures that every new project automatically includes this field, streamlining setup and maintaining uniformity across projects.
Microsoft Project’s versatility shines through these five features: copying and pasting from Excel, using custom fields with formulas, employing graphical indicators for visual status updates, exporting to Excel for advanced reporting, and leveraging the Organizer to manage global templates. These tools empower project managers to work more efficiently, communicate effectively with stakeholders, and maintain consistency across projects. By mastering these features, you can unlock the full potential of Microsoft Project, making your project management tasks smoother and more impactful.
| Feature | Description | Key Benefit |
| Copy & Paste from Excel | Import task lists from Excel with formatting intact | Saves time and preserves visual structure |
| Custom Fields with Formulas | Calculate the planned and actual % complete | Tracks progress against baseline |
| Graphical Indicators | Visual cues for task conditions | Quick status identification |
| Export to Excel (Visual Reports) | Create PivotTables and charts in Excel | Enhances analysis and stakeholder reporting |
| Organizer for Global Templates | Save custom fields to the global template | Ensures consistency across projects |