Let’s face it, our attention spans are short. And they are getting shorter. All the content we digest from the internet is developed to capture our attention and hold it for as long a possible, but we all know that something shinier or sexier will show up any second now.
When it comes to conveying important project information to stakeholders, clients or colleagues, we have to take the same approach. Communicating information effectively has become a must-have skill that every project professional needs to know. And it’s all in the visuals.
Nancy Duarte, in her excellent book Slideology conveys just how vital communicating visually has become;
“Your employers and colleagues assess you by how well you communicate – skill that is reflected in annual reviews, pay increases, promotions and even your popularity. Effective communication is a a job requirement now[.] And like it or not, your profession likely requires you to communicate using a visual tool, regardless of your proficiency or training in this medium.”
Think back to the last project status report you’ve interacted with. What visuals elements did it have? Could you glance at the first page and get a clear indication of how the project was progressing? Was there color used? Just black text? Was it easy to understand?
When it comes conveying project information, every stakeholder is going ask schedule question #1 – “Are we on-track to meet our deadline?” Dates are paramount and conveying them visually with an at-a-glance picture is going to go far with any stakeholder. Sure, you can cut and paste your Gantt chart into the report. That’s a great first step if your reports are missing visuals already. But nowadays, as the trend toward conveying information visually continues, there are some great tools to help you visually report your project progress and dates on a custom timeline.

Timelines are like a summarized Gantt Chart, with on the most important dates, events and milestones shown. The power in creating a timeline for your report is that you have more control over the data and can display only what you deem most important. It’s not so easy to filter your Gantt Chart in the same way.
Imagine a project report with a great timeline that highlights progress, events, completed and upcoming milestones in full color! If it was well done, you might just skip reading the rest of the report!
So without further ado, check out these 11 Project Management Timeline tools that can help your project reports become more visual, and more effective.
 Smart Draw is exactly that ‘Smart’ – it allows its users to create professional diagrams, timelines, and charts and it does the drawing for you. This software has 70 template designs and examples to help you get started. Not to mention that it also has this smart office integration feature where it can easily be integrate with Microsoft office. You can send your timelines to Word, Excel, or PowerPoint to make reporting and presentation easy in just one click.
With SmartDraw the timeline category let you visualize events in a chronological order. One thing about this is that it doesn’t give you a detailed view of your milestones or deadlines but you do have the option to link images or further information to an event.
Where Can I Get It? Check out the free download.
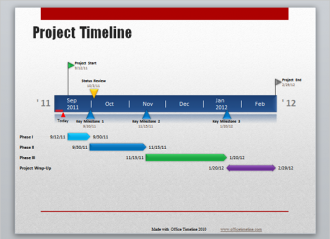
 If you don’t have time to dabble with new software, Office Timeline uses PowerPoint to quickly create timelines. Office Timeline is a plugin for Microsoft PowerPoint and can produce beautiful Gantt charts and timelines effectively. Timeline makes it simple to export your data into any office document for quality reports.
Office Timeline offers users the option to either create new timeline templates that is customized to the project or has a variety of pre-made templates for fast creation.
The interface makes is easy to manage milestone which can be easily updated if you have a project that’s constantly being restructured. If you want to know how to make a timeline in Excel, check out step-by-step instructions from Office Timeline here.
Where Can I Get It? Check out the free download.
 If you’re looking for an interactive application, with TimeGlider, you can grab the timeline and shift it from left to right or zoom in and out to get either a detailed view or just a basic overview of the timeline.
“Zoom in to 10 minutes or zoom out to see billions of years”. With a simple collaborative interface you can customize each event with a special icon, webpage, title and description for those who will be reviewing it. Although TimeGlider is web-based and it will be difficult to get some output to embed into a file, this is still a pretty cool tool.
Where Can I Get It? There is a free account for students, a basic plan is $5/month and it varies for enterprises.
 RWT is a windows application that let you create some great timelines that can then be converted to PDFs for your reports. With this app you can create events that are organized by time of day, or date – you can also create descriptions, add images, make it visually appealing to the eye.
Once the events are created you can simply email it off. Your timeline events are not set in stone, you can always move around the events due to any changes in the project.
Where Can I Get It? Check out the free account.
 Tiki-Toki is unlike the rest. It’s a web-based timeline creator that lets you develop 3D timelines with images and videos. You can colour code your events, easily share your timeline and collaborate with others. Although it’s easy to collaborate, embed and share your timeline online, you could probably take a screenshot to get some output for your report.
Where Can I Get It? Check out the free account.
 MyHistro is a location focused timeline that allows you to create stories and manage events that occur in a specific location. Once the timeline is developed you can export it to a Google Earth format or pdf file for reporting.
Where Can I Get It? You can sign up for a free account on the website or get the app from Apple iTunes.

 Preceden makes it easy to manage and organize your events in a simple format. Structure your schedules better with these project management focused timelines and layers features. You can even add color-coded events to make it easier to highlight key dates. Preceden also allows you to zoom right in to the last seconds or just have a broad overview of months.
You can also control who views your timeline with privacy control and if you want to share it, just download it as a PDF or CSV file. Preceden is collaborative, interactive and states that it can support dates way into the future.
Where Can I Get It? There is a free trial version available and the paid version is $39.
 GraphicSchedule is a linear scheduling tool that allows project managers to generate their CPM schedules into a more appealing illustrative presentation.
Focused on merging a projects visual and tactical information together, GraphicSchedule makes it easy for you to integrate your project information into Excel to better create and visualize your linear activities and other CPM schedule data at a glance. What about ever-changing scheduling? You can simply make those updates to your visual with this software.
Create beautiful proposals and communicate your complex construction project in a way that everyone would find attractive with GraphicSchedule.
Where Can I Get It? There is a free trial version available and the paid version is $75/month for individual.
 A great way to make sure you’re going to be on the right track is to have a forecast of your plan and SmartSheet can help with that. You can either customized their pre-formatted timelines in Excel to your project or manually create one based on what information you would like to report and track.
SmartSheet is integrated with Office Timeline and is another option/ add-on tool that allows you to create a more appealing illustration of your project plan.
Where Can I Get It? You can register for a 30-day free trial version that is available and a paid version is $14/month for individual.
 Diagrams are a great way to spice up the way you present your data to your colleagues. Lucidchart provides customized diagrams that would make mapping out your project plan or team hierarchy simple. You can also reduce the amount of emails or meetings with the online collaboration tool that provides sharing permissions, administrator accounts, auto-updates for published files and file security for your project data.
Lucidchart offers a variety of smart shapes that follow industry standards, free reusable templates for teams or individual and the benefit of SaaS so teams can work without issue on any web browser.
Where Can I Get It? There is a free trial version available and the paid version for a basic plan is $4.95/month.
 Milestones Professional is provided by Kidasa Software, which is a project management tool that can be linked with Oracle Primavera, Excel, Microsoft Project and others.
This software was created to help you manage large project schedules by giving you the ability to organize, create timelines, track and report your findings in minutes. You can easily produce your Microsoft Project or Primavera schedule into a more visually appealing presentation when reporting your progress and can easily update your presentation with Milestones Professional with your schedules latest updates by simply clicking refresh.
Get an eye on the bigger picture of your projects progress with Milestones Professional.
Where Can I Get It? There is a free trial version available, with the option to purchase licenses.
—
Timelines can be a powerful visual strategy to record events in a sequential format for better tracking, summarizing and reporting data. You can simply pick out patterns and see where progress is being made.
Adopting a visual method of presenting data to others will not only make it easier on you when preparing a project report last minute but it will also make it easier to bring forth detailed data and project information in an organized way.
EDITOR’S NOTE: This post was originally published October 2015 but has been updated and revamped. The update includes 11 tools instead of the original 8.