On Demand Course
Power BI Foundations for Project Controls
Beginner level introduction to Power BI. Transform your data in Power BI using Power Query, apply DAX formulas for advanced calculations, and build effective data models.
3 Quizzes
Certificate of Completion
Software Included (Windows Required)
Perfect for Beginners
Language: English (with subtitles)
Instructor: Yash Desai
NEW On Demand Course
Power BI Foundations for Project Controls
Transform your data in Power BI using Power Query, apply DAX formulas for advanced calculations, and build effective data models.
3 Quizzes
Certificate of Completion
Software Included (Windows Required)
Perfect for Beginners or Intermediates
Language: English (with subtitles)
Instructor: Yash Desai
On the whole, a good course for planners / schedulers wishing to see how job specific dashboards with universally accepted reports are built in Power BI. The majority of other material I've seen on Power BI is typically related to sales: not totally relevant for Project Controls, so well done for this.
steven queen
Course Reviews
About the Course
In this course, you will gain hands-on experience with exporting data from Primavera P6, organizing and preparing data in Excel, and linking Excel to Power BI. You’ll learn how to format and transform your data in Power BI using Power Query, apply DAX (Data Analysis Expressions) formulas for advanced calculations, and build effective data models.
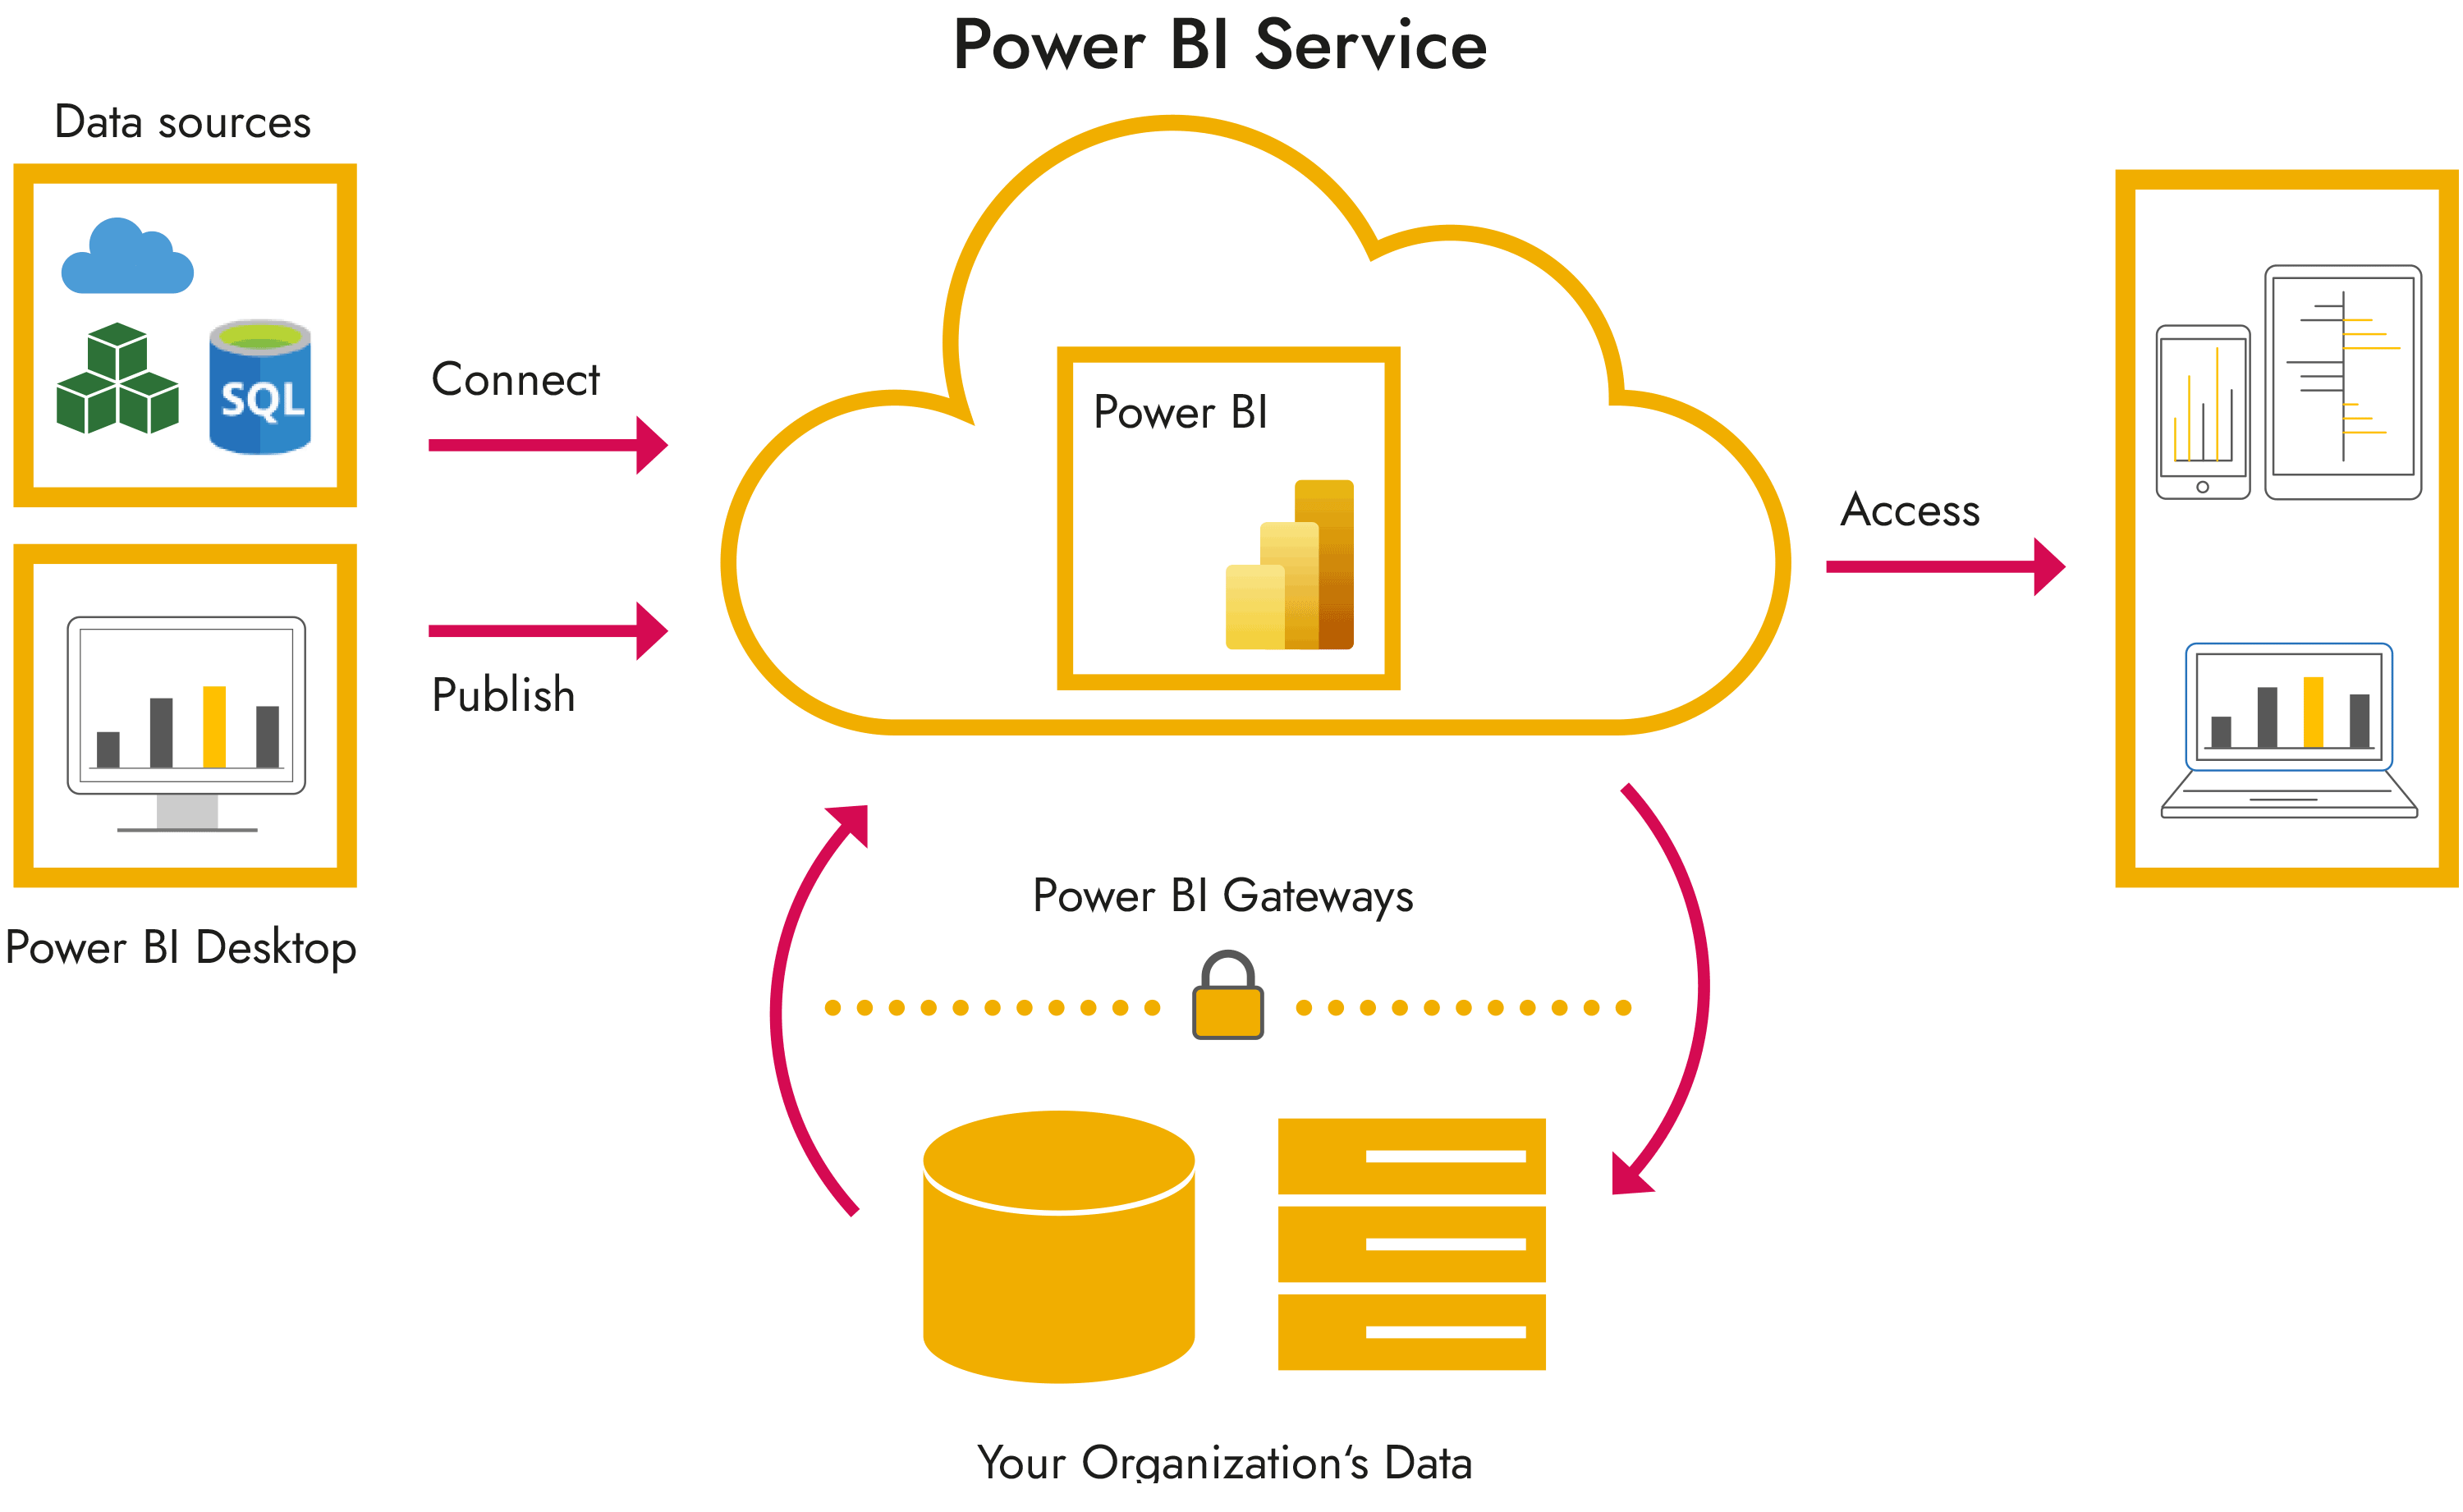
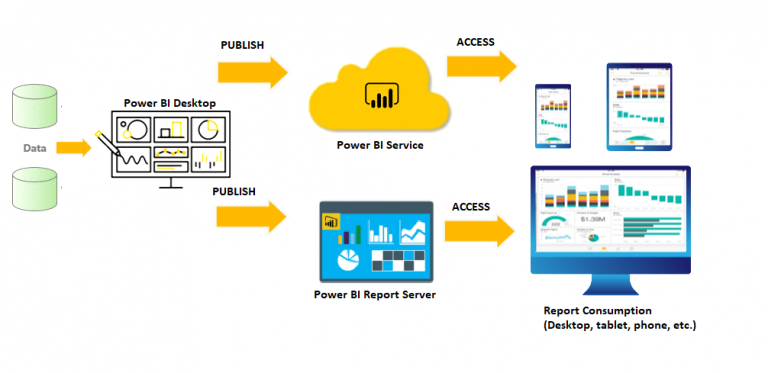
Additionally, you will explore using filters, designing interactive reports, and sharing them via Power BI Service. This course is tailored for professionals seeking to streamline project data analysis and reporting using Power BI.
What You'll Learn
Who Is This Course For?
Project Controllers looking to enhance their data management skills
Data Analysts who want to build a strong foundation in data analysis
Project Schedulers can benefit from improved tools to manage timelines and resources effectively
Project Managers will gain insights into data-driven decision-making for better project outcomes
Students interested in data analysis can learn valuable skills that will boost their career prospects
About the Course
In this course, you will gain hands-on experience with exporting data from Primavera P6, organizing and preparing data in Excel, and linking Excel to Power BI. You’ll learn how to format and transform your data in Power BI using Power Query, apply DAX (Data Analysis Expressions) formulas for advanced calculations, and build effective data models.
Additionally, you will explore using filters, designing interactive reports, and sharing them via Power BI Service. This course is tailored for professionals seeking to streamline project data analysis and reporting using Power BI.


What You'll Learn
Who Is This Course For?
Project Controllers looking to enhance their data management skills
Data Analysts who want to build a strong foundation in data analysis
Project Schedulers can benefit from improved tools to manage timelines and resources effectively
Project Managers will gain insights into data-driven decision-making for better project outcomes
Students interested in data analysis can learn valuable skills that will boost their career prospects

Download the Power BI Foundations for Project Controls Outline
Course Outline & Duration

3m 06s | ||
Data Preparation for Power BI | 3m 06s | |
Importing and Transforming Data | 3m 21s | |
Exploring Power Query Functions | 4m 51s | |
Quiz | 10m 00s |
Cardinality and Slicers | 3m 48s | |
Creating Relationships | 4m 57s | |
Understanding Different Views and Relationships | 5m 52s | |
Creating Basic Visuals | 3m 58s | |
Intro to DAX and Basic Visuals | 11m 00s | |
Formatting Visuals | 16m 17s | |
Importing Baseline Data and Computing Metrics Using DAX | 13m 54s | |
How to Create an S-Curve | 11m 34s | |
How to Build a RAG Status Donut Chart | 6m 13s | |
Exploring Conditional Formatting | 10m 04s | |
Quiz | 10m 00s |
Adding Bookmarks for Visuals on the Dashboard | 14m 10s | |
Publishing Power BI Reports | 2m 41s | |
1m 35s | ||
Course Wrap-Up | 0m 47s | |
BONUS - Extending Power BI with Automation | 1m 25s | |
Quiz | 10m 00s |
Course Outline & Duration

3m 06s | ||
Data Preparation for Power BI | 3m 06s | |
Importing and Transforming Data | 3m 21s | |
Exploring Power Query Functions | 4m 51s | |
Quiz | 10m 00s |
Cardinality and Slicers | 3m 48s | |
Creating Relationships | 4m 57s | |
Understanding Different Views and Relationships | 5m 52s | |
Creating Basic Visuals | 3m 58s | |
Intro to DAX and Basic Visuals | 11m 00s | |
Formatting Visuals | 16m 17s | |
Importing Baseline Data and Computing Metrics Using DAX | 13m 54s | |
How to Create an S-Curve | 11m 34s | |
How to Build a RAG Status Donut Chart | 6m 13s | |
Exploring Conditional Formatting | 10m 04s | |
Quiz | 10m 00s |
Adding Bookmarks for Visuals on the Dashboard | 14m 10s | |
Publishing Power BI Reports | 2m 41s | |
1m 35s | ||
Course Wrap-Up | 0m 47s | |
BONUS - Extending Power BI with Automation | 1m 25s | |
Quiz | 10m 00s |
I recently took the Power BI for Project Controls course from Plan Academy, and I must say, it was an incredibly practical and visual learning experience. The course focuses on using real project controls data, which made it easy for me to relate the lessons directly to my own work. I especially appreciated the emphasis on visualization – it’s not just about analyzing data, but about presenting it in a way that’s clear and impactful. The hands-on approach helped me gain confidence in using Power BI to track project performance, identify trends, and generate insightful reports. Whether you’re new to Power BI or looking to improve your skills, this course is a game-changer for anyone in project controls.
Javid samad
Course Reviews
What You Get:
20+ Video Lessons
Professionally recorded videos that teach you to transform your data with Power BI.
Challenging Quizzes
Lock in your learning by completing quizzes for each module.
Project Files
Download project files and follow along with the videos.
Training Platform
Track your progress and earn awards as you complete your training.
Learn Anywhere, Any Time
Access your training material from anywhere at any time. Learn at your own pace.
Support Forums
Ask questions, get advice, tips &feedback from our experts in the support forum.
Your Instructor

Yash Desai
Data Scientist - Movar
Yash Desai is the Data Scientist at Movar Group and holds a Master's degree in Big Data Science. His expertise lies in data engineering (Azure DevOps) and data analysis (Power BI, Power Apps). He creates end-to-end solutions for companies in traditional project controls moving them to the digital age. Yash also has expertise in machine learning and deep learning.
This course was created in partnership with Movar Group.

frequently asked questions
First, a learner will go through the training videos for each module, after which they’ll be given a quiz, workshop, or assignment to complete depending on the course. Workshops and assignments are graded by one of our learning experts.
Once all of the modules, quizzes and assignments have been successfully completed, a certificate will be issued.
Plan Academy focuses on project controls, engineering and construction professionals working in industries such as Construction, Oil & Gas, Manufacturing, & Energy.
The training will be helpful for anyone from complete beginners to intermediate level students looking to get an introductory understanding of Power BI and its applications with Primavera P6. You will learn how to create interactive reports and enhance your data management and analysis skills.
You can complete the training as fast or as slow as you like. It’s completely up to you. However, you will have access to the course for the full term of your package (12 months).
You can always watch our tips, tricks, and tutorials here or on our YouTube channel - and while you're there, subscribe to stay tuned to the latest uploads!
Upon purchase of a course you’ll get access to our training platform where you can watch video lessons online, download files and complete the homework. You can even login to our website on a tablet or mobile device to watch anytime.
The Power BI course is foundational and does not cover the following aspects:
- Earned Value Matrix reporting - like reporting on SPI, CPI and other Earned Value variables.
- Comprehensive exploration of all Power BI features
Starting your journey in construction and project management?
Plan Academy's industry-leading courses are now 40% off for university and college students. Learn from the same curriculum trusted by major Construction & Engineering companies.
What you get:
- Full access to course materials for one year
- Industry-recognized certificates and PDUs
- Hands-on Primavera P6 training
- Career-ready skills in project controls and scheduling
- Support from industry professionals
Valid student ID or email address required. Email to apply: info@planacademy.com
7-Day No Questions Asked Money-Back Guarantee
When you register, you are fully protected by our 100% Satisfaction-Guarantee. If you don’t feel like you’ve received value and you decide you want to cancel any time within the first 7 days, just let us know and we’ll send you a prompt refund. No hassles, headaches or hoops to jump through.

“We’re so confident that you’ll find Plan Academy useful that you have 7 days to change your mind. We won’t make you beg or invoke any silly rules or conditions – if you’re not satisfied within your first 7 days then we’ll refund you without any fuss.”
We accept these major credit cards. All prices USD.

