It’s not very easy to find Relationship Lag in Primavera P6 project schedules. There aren’t really any features to highlight which relationships have lag or lead time.
But understanding how leads or lags are used on your Primavera P6 project is a vital part of analyzing a project schedule.
We need a process to find relationship lag in Primavera P6 schedule.
And I’m going to show you two.
What is a Lag or Lead in Primavera P6
Lag time is a duration that is added to a relationship link to impose a wait time between an activity and it’s successor in Primavera P6.
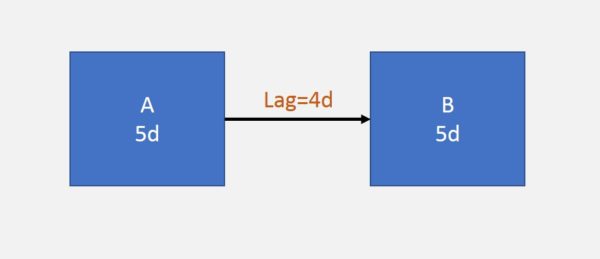
B will wait 4 days after A is Finished to Start
If the lag is a positive duration, then the successor activity will have a wait period before starting.
If the lag is a negative duration (also called a lead or lead time), then the successor will overlap the predecessor activity.
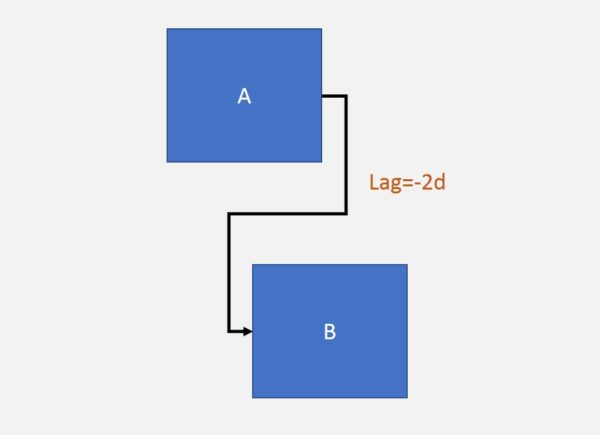
B will start 2 days before A’s Finish date creating an overlap
Lags can be applied to any relationship type to help you model your project’s work and any waiting periods between activities. Lags are an inherent part of PERT diagraming method (Program Evaluation Review Technique) that we use to build CPM schedules.
Why You Should Avoid Using Relationship Lag in Your Primavera P6 Schedule
So here’s the deal with lag and lead times in Primavera P6.
Relationship lag is a very convenient tool to help us model our work in Primavera P6. Using lag on dependencies can be very helpful to add in periods of wait or non-work or even to create overlapping activities as in the diagram above.
However, the concensus and best practice is that the use of relationship lag should be minimal if it’s used at all.
Why?
According to the Practice Standard for Scheduling, a document prepared by scheduling experts at the Project Management Institute, using Relationship leads or lags add significant schedule risk to a project. The main reason is the lack of visibility of lag delays on project schedules. (PMI isn’t the only one with this recommendation)
Lag time is hard to identify and document – it isn’t obvious when looking at the Gantt Chart or when analyzing a schedule’s dates.
When lag time is used on a schedule, schedulers very rarely document why the delay was added, causing construction managers to scratch their heads. Time IS money, after all.
As a best practice, any lag or lead should always be documented in a Primavera P6 Notebook topic on the activity.
Or better yet, follow PMI’s standard and use full activities to represent lead or lag delays. This approach makes lags and leads very visible on a project schedule and also allows for more flexibility.

An example of replacing a Lag with an Activity in Primavera P6
It’s common for less experienced planners to submit schedules with relationship lag. But be aware that your client may not accept your schedule. Construction claims consultants will do the same.
In Primavera P6, we really need to be able to find out if a schedule uses relationship lag.
Unfortunately, inside the Activity screens in P6, there seems to be no way to sort or filter activities by lag. So we need another approach, one that is easy and reusable.
Can I Use Primavera P6’s New Relationship Details Fields?
As of Primavera P6 16.1, 2 new fields were added to Primavera P6 to help get better visibility on relationship dependencies: Predecessor Details & Successor Details.
These 2 new fields were added to give the P6 Activities screen a similar feel to Microsoft Project. The Successor Details field lists an activity’s successors, and also displays the lag or lead in format like this:
- A1205: FS +1d
- A2540: SS -3d
Here’s a visual so you can see these 2 details fields in action:
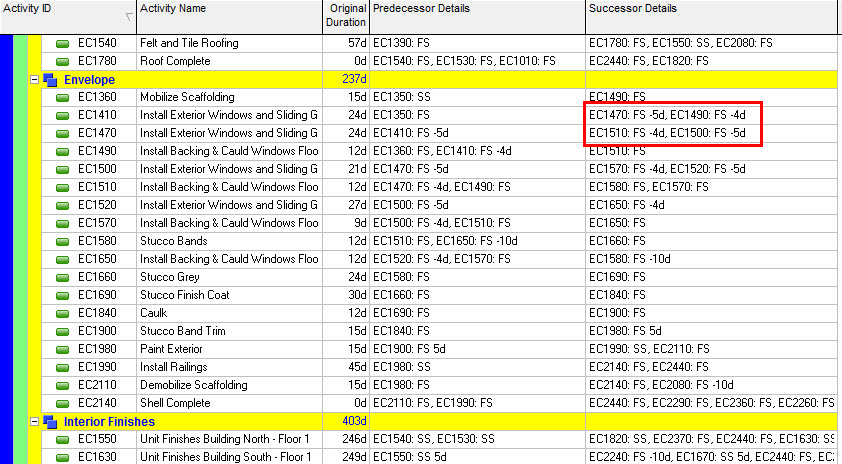
The new Predecessor & Successor Details in Primavera P6 (as of r16.1)
While Predecessor & Successor Details fields can help us gain some visibility on which activities have lags, it’s entirely a visual scan and search effort.
There is no infallable way to apply a filter to these fields to extract only those activities that have a lag or lead in their relationship. Unfortunately, we have to resort to other tactics to see clearly the lags and leads in a Primavera P6 schedule.
How To Build a Relationship Lag Report in Primavera P6
Fortunately, the Reports section of Primavera P6 has the ability to access and filter on the Primavera P6 “Lag” field.
It’s pretty easy to build reports in Primavera P6. And the reporting features are able to report on a project’s relationships. Using Filters, we can create a nice report that shows only Activities that have relationships with leads or lags. Here’s how:
Step 1 – Create a New Report
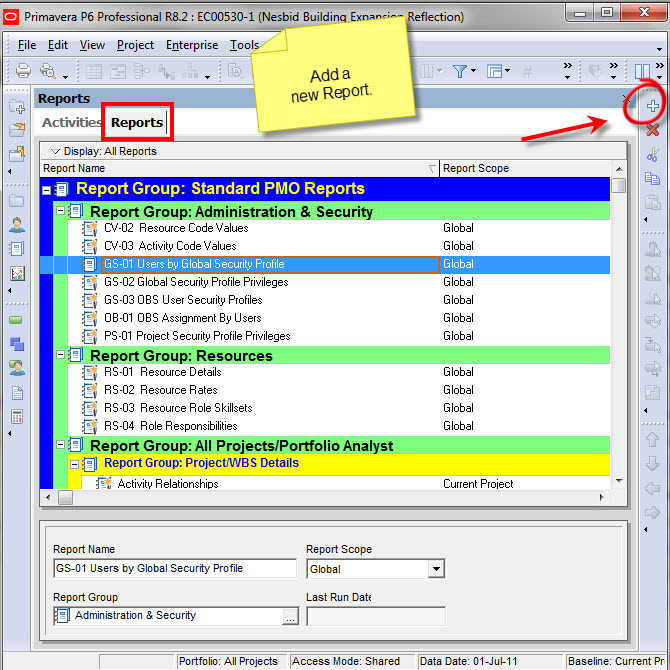
You don’t have to have a project open to do build this report.
Navigate over to the Primavera P6 Reports screen: Tools menu -> Reports -> Reports.
Click the Add button on the Command Bar, or right-click and choose Add from the menu to add a new report to your Primavera P6 database.
Step 2 – Choose the Report Subject
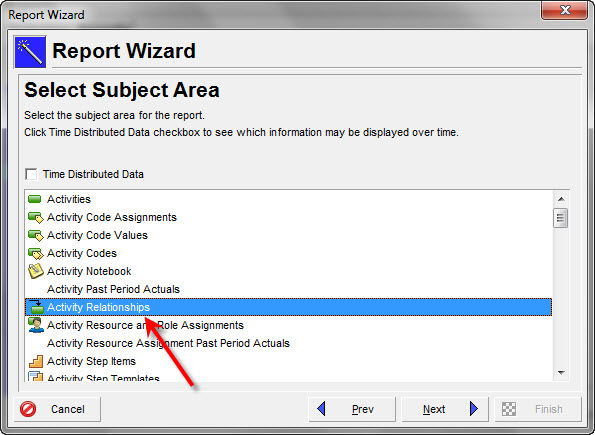
When the Report Wizard comes up, click Next to create a new Report. On the following screen, select the “Activity Relationships” subject area and click next.
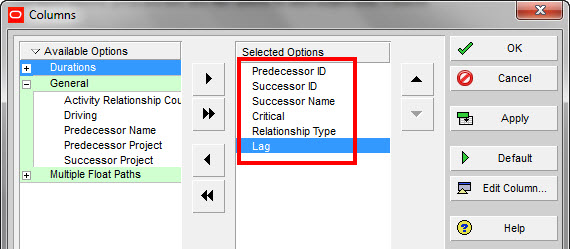
Step 3 – Choose Columns
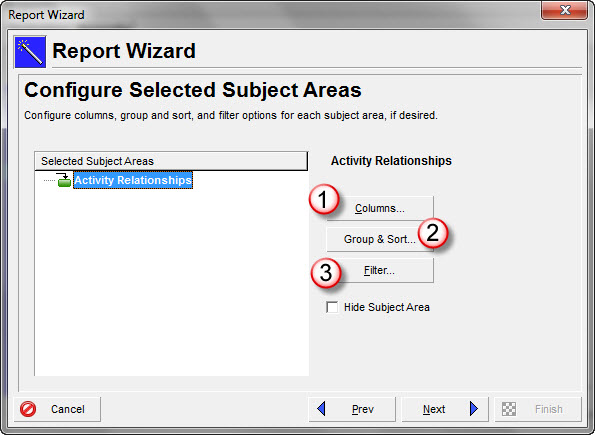
Select the columns as shown. Click OK.
**NOTE: I’ve discovered that both the “Predecessor ID” and “Successor ID” columns will always be renamed by Primavera to “Activity ID” in the output of the report. If you click OK after selecting columns and go back to the column choosing screen, these two columns are renamed to “ID”. I can’t change them either….c’est la vie!
Step 4 – Turn Off Group and Sort
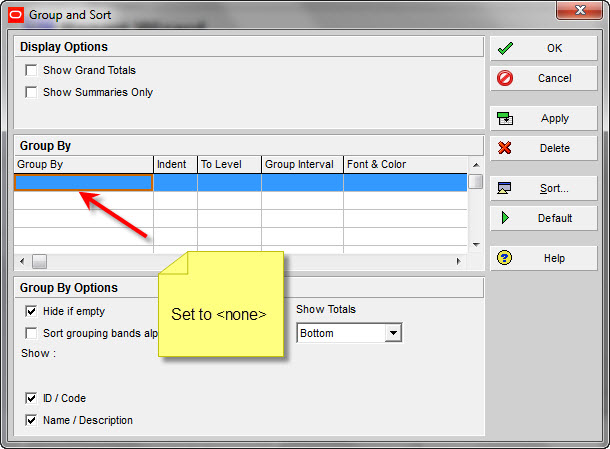
Click the Group and Sort button and set it to <none> or leave the Group By field blank. Click OK.
Step 5 – Set a Custom P6 Filter to Find Lag
Click the “Filter…” button. In the Parameter dropdown, find and select “Lag”.
Set the conditional dropdown to “is not equal to” and type ‘0’ in the Value column.
This combination will filter for both lags and leads (ie: negative lags).
Click OK to save your Filter.
Step 6 – Save Your Primavera P6 Relationship Lag Report
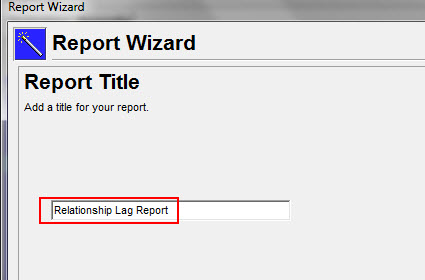
Click Next.
On the following screen, name your report “Relationship Lag Report”. Click Next.
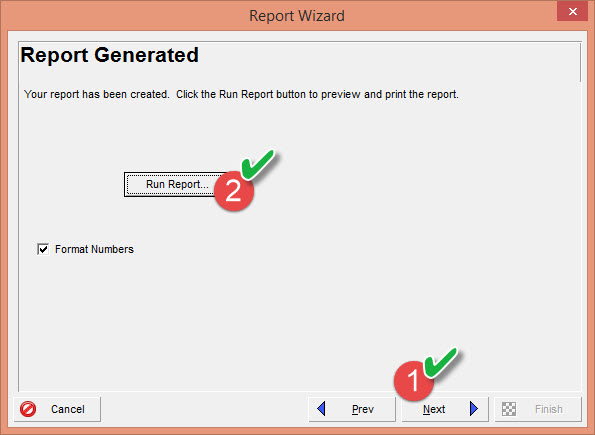
Click Next first to save your report, then come back and run it.
Before you click Run Report on the Report Generated screen, click Next again and Save your report. Click Finish to close the Wizard.
It’s ideal to Save your report first before running it. It may not run if you do not have a project open first.
Step 7 – Open a Project and Run the Primavera P6 Lag Report
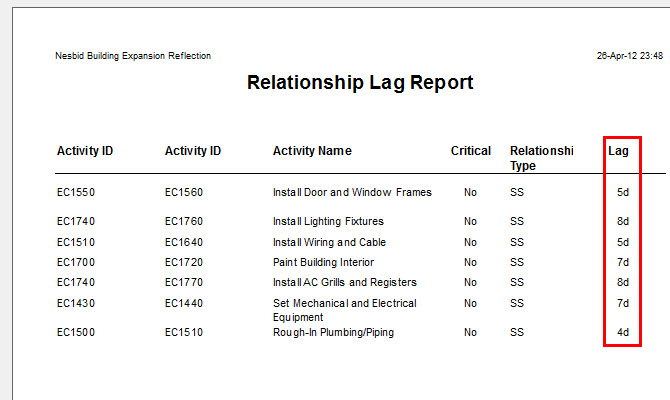
Open a Project and then run your report from the Reports screen.
To run the Report, right-click on the Report name and choose Run -> Run Report from the pop-up menu.
You will see a lag report that looks similar to the above screenshot.
Step 8 – [OPTIONAL] Send the Report To Excel for More Filtering Abilities
Some people don’t know that you can send Primavera P6 report data to a .csv file to open in Excel. Excel will have more filtering features for you to use on the data, so it can be really handy.
When you the run the report, rather than choose the default Print Preview option, choose “delimited text file” and specify a filename.
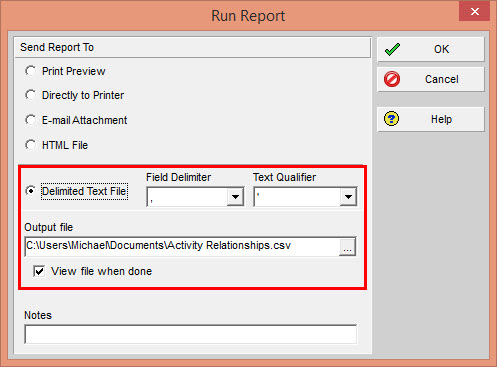
Output the Report Data to a .csv file to work with it in Excel
Open the .csv file in Excel and enjoy!
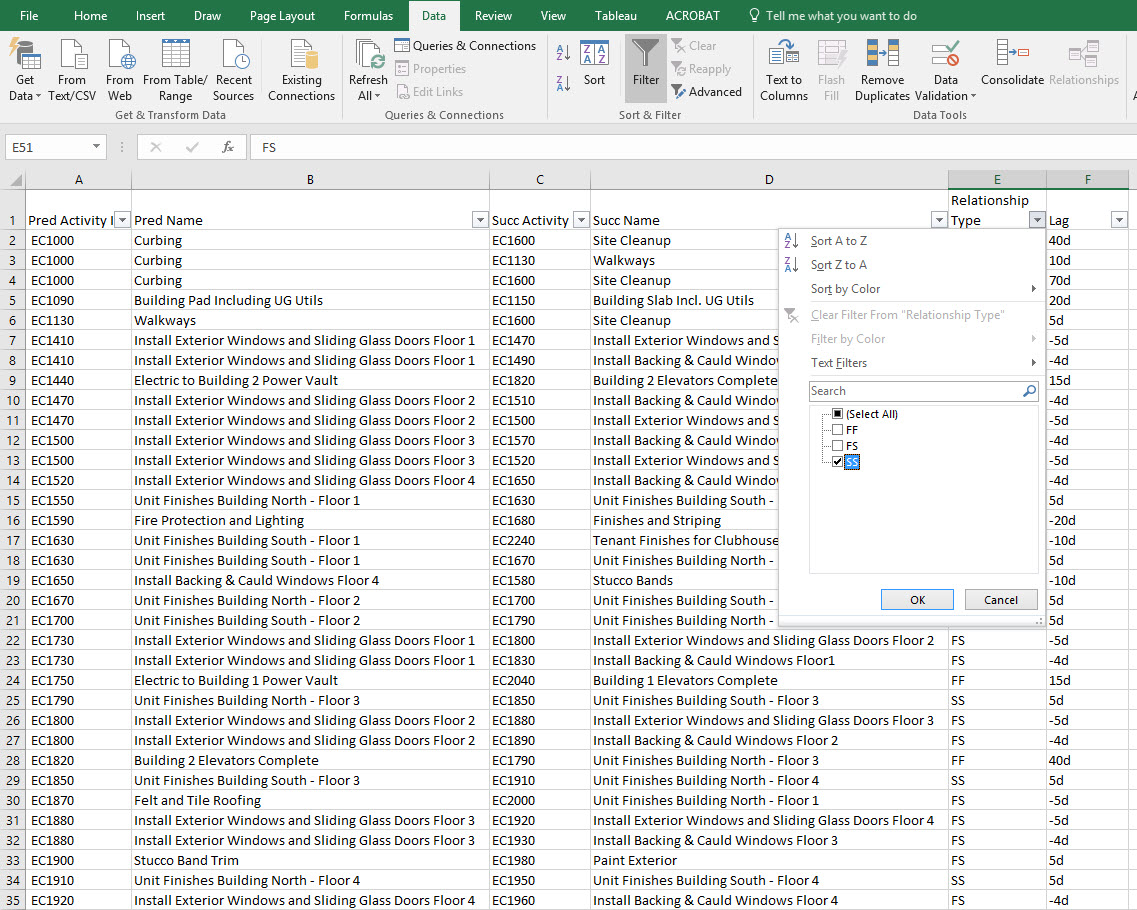
Use Excel to for more flexibility filtering your Primavera P6 Lag report
Conclusion
Having this report pre-built will help you be prepared anytime you need to run some analysis on a schedule, perhaps even a schedule a contractor has submitted. So keep it in your arsenal of analysis tools.
It’s worth mentioning that another approach that works is to export your project data to an Excel .xls using File->Export, including the relationships table.
You can then use the filtering tools in Excel to filter relationships that have lead or lag delays.
I prefer to avoid Excel in this case because the export takes too many clicks to produce the report. My P6 report can be run with 3-4 mouse clicks max with the same end result.
If you must use lags on your schedule, go ahead. Unless your client refuses to let you use them, you are welcome to use lags on your schedule.
However, my recommendation is to use them sparingly. Finding lags on your schedule is not the only issue you will encounter with lags, there are others I won’t go into here. The key here is to 1) be aware, and 2) document document document.
EDITOR’s NOTE: This post was originally published May 2012 but has been completed updated and revamped for completeness and accuracy.
Mark,
I appreciate your tutorial!
You mentioned the “Relationship Table”. Where is this found in P6?
Thanks!
Gary
Hi Gary,
The relationships table is inside the database and tracks what activities are linked, but this table isn’t accessible directly through a P6 screen. That’s why it is difficult to find lag, because we can’t simply pull up a nice relationships table and find it. The report we build in this tutorial can access the relationships table in the database and put that info into report-format.
Hope that helps! Thanks for the feedback!
Michael
The same you can do using Export to Excel Datasheet. After export you can play with data as you want (sorting filtering etc.)
Sergei,
Thanks for pointing this out. Exporting to Excel would be another method of approach on this. You can export all relationships, then filter for lag as well. I highlighted the P6 report method mainly because it is a bit simpler, involves less clicking and stays within P6.
Regards,
Michael
I use the following method to find hidden or unwanted lag.
1: open the project
2: go to activity view
3: add the “lag” column
4: change group and sort to “none”
5: click on the lag column to sort lag into ascending or descending order to group all of the lag together so you can easily find the hidden or unwanted lag next to your activity
Ann,
I can’t find the lag column in my install. What version of P6 are you using?
Michael
Hi Ann,
there is no such a column called LAG
How can we find non-overlapping lags? is there any easy way without using Analyzer programs?
Eren,
Good question! I suggest you build this report. Customize the Filter to look for (lag not equal to 0d) AND where (lag is greater than original duration).
Warmest regards,
Michael
Thank you for your response,
But in the filter menu , i can’t add a filter like you said. There is no original duration or any duration selection.
Best regards,
Eren
Eren, you are right – that doesn’t work.
You can customize this report somewhat to add the Original Duration column to the report. After that, P6 is going to have some limitations as the filtering won’t be able to find overlapping lag. On the Run Report dialogue for the report, there is an option for Ascii text file – this will generate the report data in a .csv file which can be imported to Excel. Then you can do your analysis in Excel with Excel’s more advanced filtering abilities.
Sorry it isn’t an easier process. Please try this solution and let us know how it turns out.
M
Really superb Micheal.Really works well to control the window of a project so simply.need more like this how can i find.
Warm-full regards,
Prabu
This was a very helpful tutorial. I’ve been trying to solve the mystery Lag problem for a while now. Until I stumbled upon this article, my plan was to rewrite our scheduling specification so that Lags were not allowed at all.
Thank you,
John
Thank you John,
Many owner companies will not accept schedules with lags. It’s a growing trend that is based on the fact that lags have little visibility and appear as unproductive time. You might still consider it.
Excellent tutorial Michael. May I also suggest that if users have a need to interegate P6, then the AcumenFuse tool is very fast at producing many metrics that can guide you on the “health” of a schedule.
All you have to do is Import an XER file into AcumenFuse, and within 30 seconds you can have a full analysis carried out showing lags/leads/float/open ends etc.
Have fun!
Nice job sir. Anyway, how can we save lag report like Layout so we can use them to another desktop/laptop?
Hi Warren, sorry for the slow reply.
If you save the report, it should be available for all users of that P6 database. Alternatively, if you right-click any report, you can export it for import to another database.
Hope that helps,
Michael
Michael ,
Thanks a lot . It is really useful
Dear Michael, I appreciate your demo & I learn to find the lags report. Thanks dear.
Bala Din
any one can help me i am unable to load XER file in p6 praser .
when i click on load button to load XER file its shows the error ” could not load an object because it is not available on this machine.” and after click on OK button its goes to VB and shows ” compiler error : can’t find project or library”
Hi i had a problem activity 1 with a duration of 25 days and activity 2 -06 days and i had given relationship as activity 2 SS with a lag of 3 days and FF as a lag of 3 days but my star date of activity 2 was showing according to FF relationship
Could please describe about predecessor activity column named “Driving”
@sim
A driving relationship is one in which the Free Float is 0 between an activity and it’s successor. Essentially, the successor activity is getting it’s start date from this activity – we call that a driving relationship. A Non-driving relationship would mean that there is some delay between the activities which might be because of how the logic is structured. If you look on your gantt chart, dashed relationship lines are non-driving relationships. Solid relationship lines are driving relationships.
Hope that helps!
Michael
In step 3 there’s a note about the difficulty of changing the coumn headings for Predecessor and Successor IDs from Activity ID. It’s pretty straightforward, really. While you are in the Columns window illustrated in step 3 highlight the heading Predecessor ID then click the “Edit Column” button. In the “New Title” box overwrite the existing title with, say, “Predecessor”. Click OK then do the same for the Successor ID.
It worked for me…
how can create a percentage lag in p6 , such as microsoft project?
best regard.
Is there any filter available rather than report gen to do this,I guess there is no,if any pls share it
Sorry, no filter, that’s why I put this tutorial together as it’s not trivial.
@mehran – no percentage like this in P6. Sorry.
After saving the report, you can edit same and change “Activity” with “Predecessor” and “Successor.” This will also solve the “Relationship” with the missing “p.”
Dear Micheal,
First I would like to thank you for all information which so useful,
secondly what you mean by (Avoid using lag or lead altogether in your schedules. Instead you should use a well-defined activity to represent any lag or lead delay in your project plan). is that mean never to use lags or leads in my schedule
Best regards
Ideally, yes, don’t use lag. Sometimes it is unavoidable however.
Michael
Micheal,
but as you know when you have project with limited time you need to use lags with relation like SS OR FS-,otherwise i will not able to make schedule according the required time.
you said in your article “it is common for less experienced planners to submit schedule with lags”,kindly i need your help to be experienced planner and not submit schedule with lags any more ,let know how if i have a limited time for any project because every time i started my schedule with FS no lags but i found that i exceed the time frame and forced to use lags.
Regards
Wisal – please no offence to anyone who is in my own words “less experienced”. I’m simply trying to point out there is a trend where companies are not accepting schedules with lags any more.
You can always replace the lag with an activity itself, and link it with no lags.
Dear Micheal;
I used the same report of lags with the change of adding free float areas but i found them (free floats) too high even over project duration while relationship free floats are within the allowed range, the question what are these high amounts of time as free floats are representing.
Regards
Micheal,
I’m sure you are not offence any one ,because you are really help us to improve our skillfulness and I really thankful you for all your effort to support us.and i mention your exact article just only to get your advise ( to be experienced planner)as you are our supervisor and i acknowledge you are experienced person and we learned from you,apologies for misunderstanding sir.
Regards
Hello Michael,
I’m not sure if this topic is still open, but in The Netherlands we have a saying: if you don’t shoot, you’re sure to miss’. So here’s my question:
I’m using your report (for which I’m greatfull, so thank you!) to find lags in a planning that my predecessor had built. I’m only interested in lags between activities, when the successor has not started yet. I’ve tried adding a column with activity status to the report, which doesn’t seem to be possible. Adjusting the filter to find only relationships where the successor hasn’t started yet doens’t seem possible either. Do you perhaps have any other suggestions?
Kind regards,
Anke
Hi Anke,
Yes, I do.
After some testing, it looks like you can add an extra line to the filter of this same report. I noticed that some of the fields (like Relationship Total Float) only have values if the activities are not yet completed. Thus you can filter on them to distinguish which activities have been completed or not.
Add a new line to the existing filter that says:
“Relationship Total Float” “is not equal to” and leave the last field blank. The result is a report of lags but only for activities that are not completed. Hope it helps.
Thanks a lot it is very helpful
Hi all
i am preparing schedule on primavera p6 and i am not assigning any resources for one particular project. can i find out actual % complete after updating it. i have to prepare a report which includes s curve. I can calculate planned % complete on total duration basis. but how should i calculate actual % complete without assigning resources. is this possible ?
We can change “Activity ID” column to “Predecessor ID” and “Successor ID” by going to modify/click “Activity ID” cell, select “custom text” and change the tittle as required. Am I right?
Thanks Mr. Michael Lepage for you posted.
Yes that’s correct.
Michael ,
Really what a wonderfully explained , the long awaited solution
I will be very thankful if you explain step by step about SDK for V17.7
Michael I’d like to offer an option that is affordable for all user to check schedule quality which includes open starts, open finishes and logic density.
https://jujuppm.com/
any similarity with the check in P6 EPPM ? this also applies the 14 points DCMA and a possibility to adjust the parameters as well…
Unfortunately this report can’t be generated in P6 EPPM. These reports only exist in P6 Professional.
In P6 EPPM, I recommend quickly exporting your data to Excel, include the Successor / Predecessor Details fiels and sorting it out in Excel.
Michael thanks you
you really help to improve my skillfulness.
Thanks a lot.
Massimo
Hello Michael
I’m Pejman
Project Control Expert in South Pars Iran
I have a question
I want to know the impact of the FF relationship on project delays in the Primavera program
Can you help me
Hello Michael
I’m Pejman
Project Control Expert in South Pars Iran
I have a question
I want to know the impact of the FF relationship And Difference by Fs relationship on project delays in the Primavera program
Can you help me
very useful
Thank you too much
Hi Michael
Sometimes the Contractor change the relationship between the activities from (FS with Lag =0) to (SS with positive Lag) . I detect this using Schedule Comparison in P6 V18.8 , or your report also, i appreciate it
My question is (SS with Lag ) increase the overall delay of the project or reduce it ?
thank you
Safwat
There’s no way to tell until you make the change and verify the results. It all depends on the duration of activities involved in relation to how much lag is added.
Hi Michael,
You can actually filter for the lag in the Relationship Details columns, the key is ensuring that you use the correct nomenclature
To find Predecessors with +ve lag use the following;
Display all rows Parameter Is Value High Value
(Any of the following)
Where Predecessor Details contains FS 0
Or Predecessor Details contains FS 1
Or Predecessor Details contains FS 2
Or Predecessor Details contains FS 3
Or Predecessor Details contains FS 4
Or Predecessor Details contains FS 5
Or Predecessor Details contains FS 6
Or Predecessor Details contains FS 7
Or Predecessor Details contains FS 8
Or Predecessor Details contains FS 9
To find Predecessors with -ve lag use the following;
Display all rows Parameter Is Value High Value
(Any of the following)
Where Predecessor Details contains FS –
Forgot to mention that obviously the same filter criteria outlined above also applies for differing relationship types i.e. SS, FF, SF etc as well as being able to be utilised within the Successor Details column if desired.
You should also ensure that your Activity ID numbering convention doesn’t use any of the aforementioned nomenclatures’.
How can you do this with two projects concurrently in one report?
Have you tried opening both projects at the same time and then running the report. It should work.