
Gantt charts serve as the indispensable backbone of project controls and scheduling especially in the realm of construction engineering. The ability to read and interpret these visual representations of project timelines is a crucial skill for anyone aiming for success in managing complex construction and engineering projects. In this post, we’ll explore essential tips and tricks to help you navigate and understand Gantt charts effectively.
Understanding the Visual Landscape of Gantt Charts:
Gantt charts are essentially visual representations of project work plotted on a timeline. Their purpose is to provide a comprehensive view of the project, illustrating the sequence of tasks and how they interconnect. While these charts can be incredibly insightful, large-scale printouts spanning multiple pages can be overwhelming and challenging to decipher.
Utilizing Software Tools:
To optimize your Gantt chart reading experience, it is recommended to use software tools such as Primavera P6, Microsoft Project, or viewer tools like ScheduleReader. These tools offer a more dynamic and interactive approach, making it easier to comprehend complex project structures. In this blog, we’ll use ScheduleReader as an example, a tool that reads both Primavera P6 and Microsoft Project files.
Most construction as well as engineering projects are complex. If you can get it summarized into a pretty picture, it’s going to make your job in managing it a whole lot easier.

Key Components of Gantt Charts:
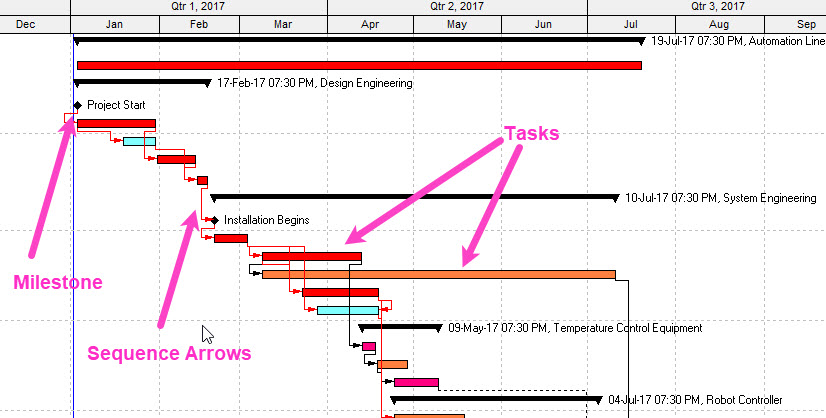
Milestones: Represented by diamond shapes, milestones are critical deadlines or major events in the project timeline.
Tasks or Work Elements: These are the fundamental building blocks of the project, illustrating the work that needs to be accomplished.
Arrows: Used to define the sequence of tasks, arrows connect different work elements, indicating dependencies. Sometimes those arrows can be easy to understand, but sometimes when they span large distances, it can get complicated. We can always turn them on or turn them off to get a better understanding.
Work Breakdown Structure (WBS):
Construction engineering projects are inherently complex, requiring systematic organization of work. The Work Breakdown Structure (WBS) breaks down the project into phases or different areas, facilitating a structured view of the project schedule’s components. The colored bars on the left of the Gantt chart represent the WBS, providing a hierarchical breakdown of the project.
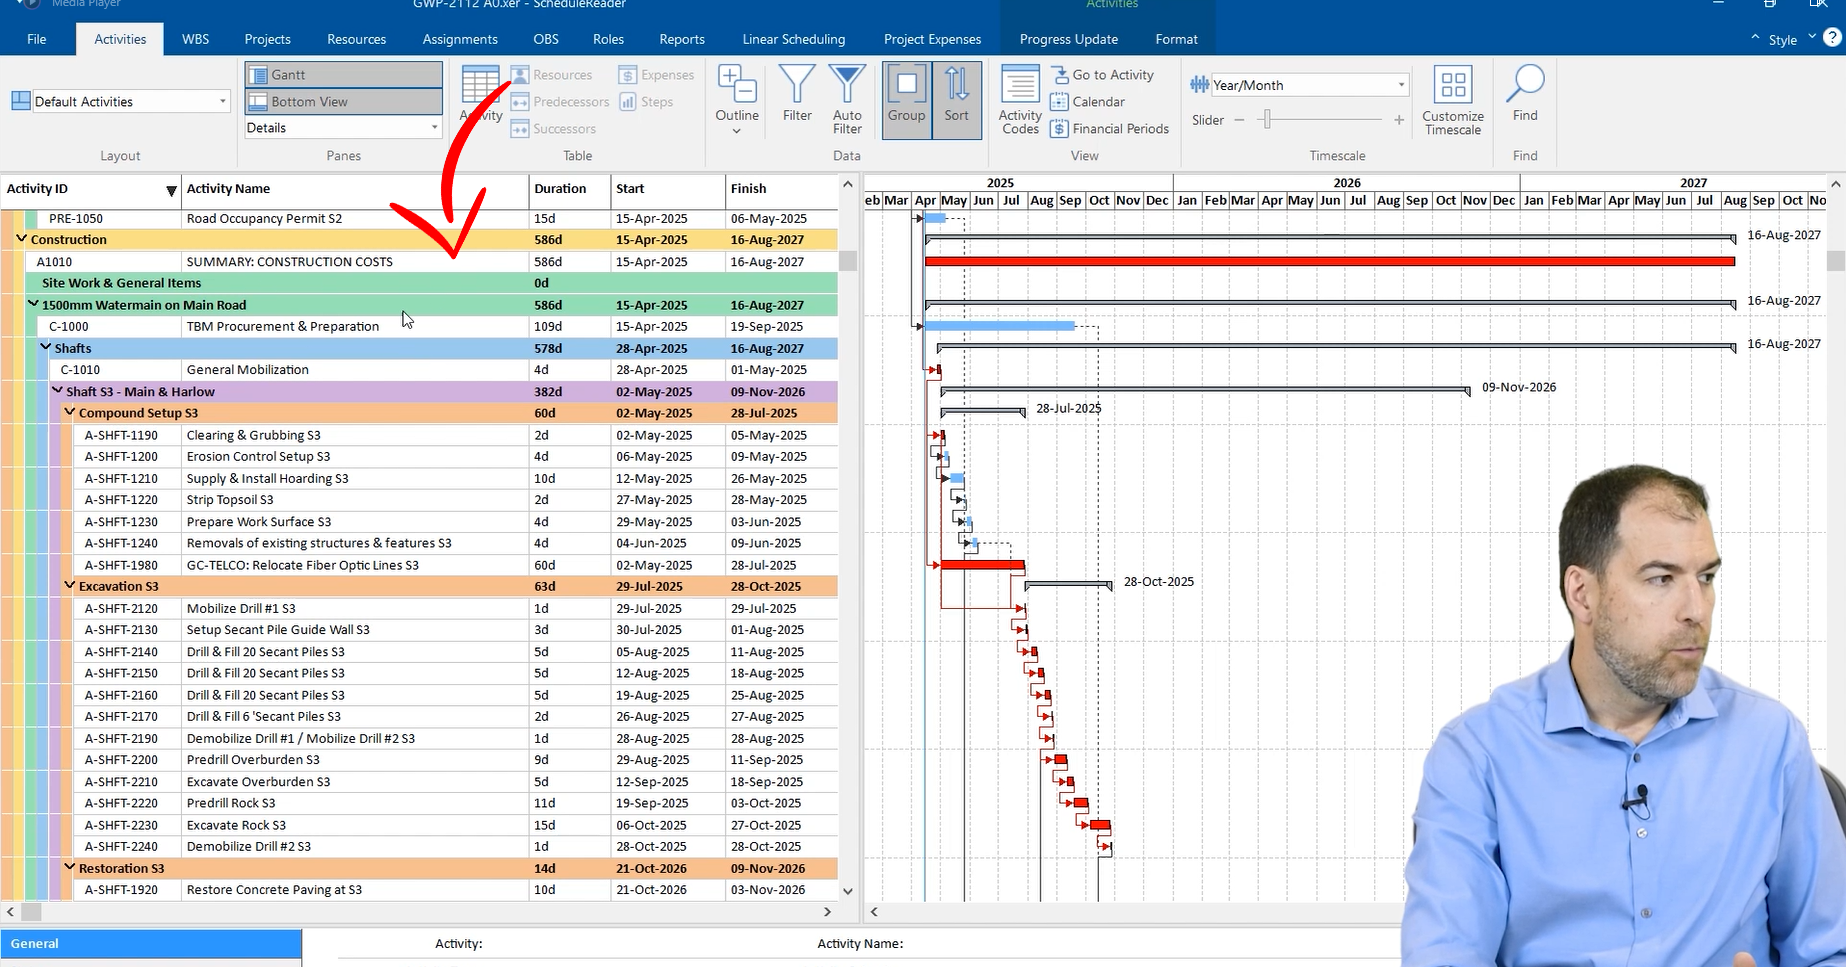
In this example, construction work is broken down into the watermain, the different shafts, the compound set up and the excavation. If we start to roll things up, we’ll see that structure repeated more and more throughout the project. That’s our Work Breakdown Structure. It helps us organize all the work in the project.
Critical Path and Activities:
In project scheduling, all activities are deemed critical, contributing to the definition of the critical path. Understanding the critical path is vital, as any delays in critical activities can lead to project delays and potential consequences. It is the most important path through the project that leads to the completion of the project.
Sequencing of Work:
Gantt charts help in visualizing the sequencing of work. While some sequences are straightforward, others may require adjustments to better understand complex relationships. Rolling up sections allows for a more comprehensive view, simplifying the understanding of intricate project details.
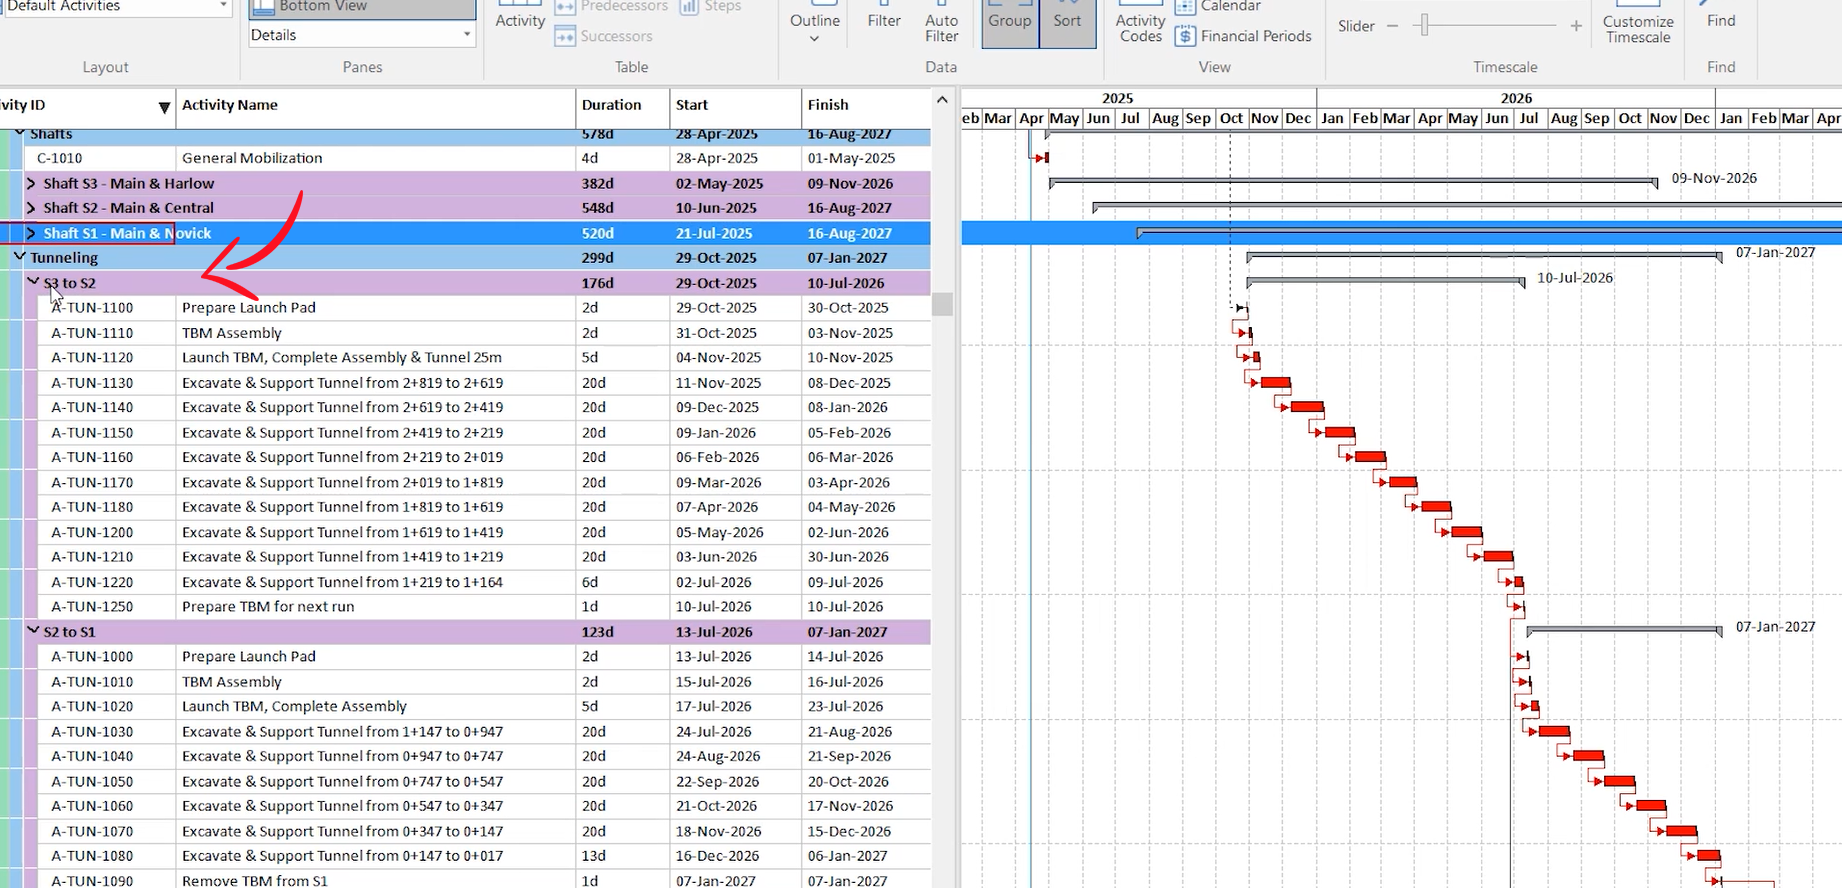
In the tunneling section above, tunneling work will be done from S3 to S2 as broken down into several sequential activities. The first activity must be completed before moving on to the next one in this sequence. Work sequence isn’t always straightforward, and you might have to adjust your view to understand it.
>>> Learn ScheduleReader with Plan Academy <<<
Managing Dependencies:
Identifying dependencies between different tasks or project phases is crucial. Gantt charts enable project managers to determine who they are waiting for and who might be waiting for them, fostering a clear understanding of work relationships and interplay.
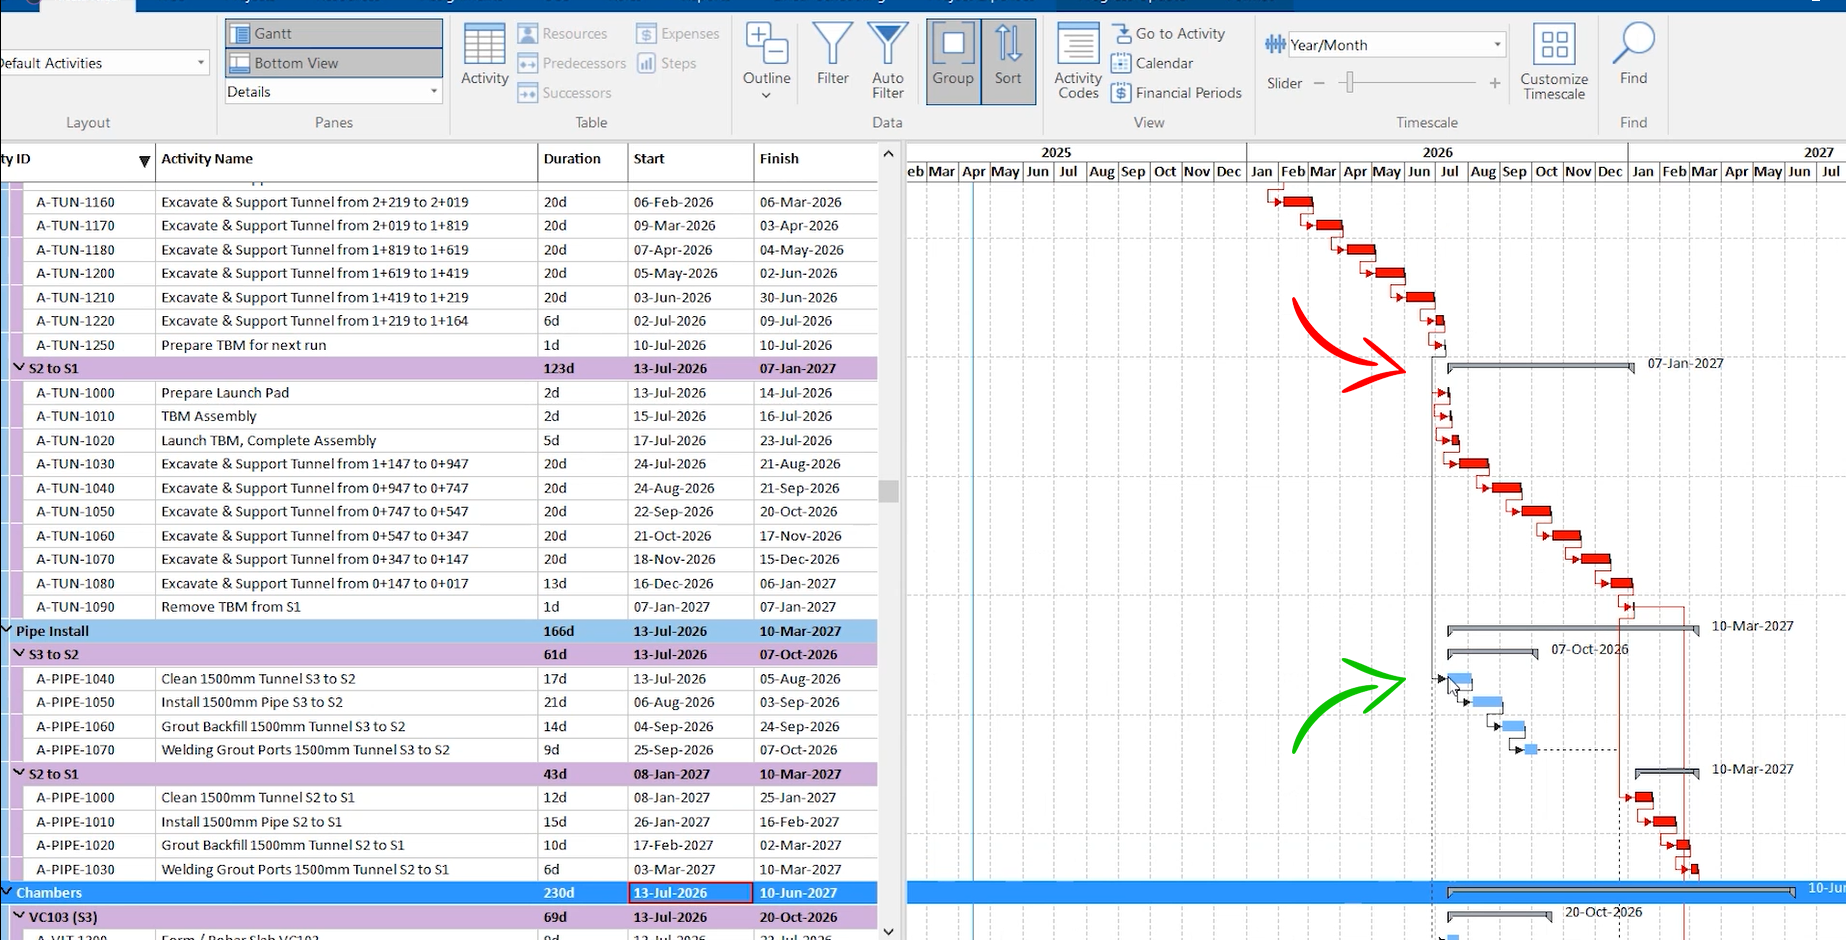
In this example, the pipe installation on this project is dependent on completing the tunneling work.
Filtering for Focus:
To avoid information overload, it’s always good practice to apply filters and focus on specific timeframes. Gantt charts can be filtered to display only relevant information, allowing for a more focused and detailed analysis of project tasks and timelines.
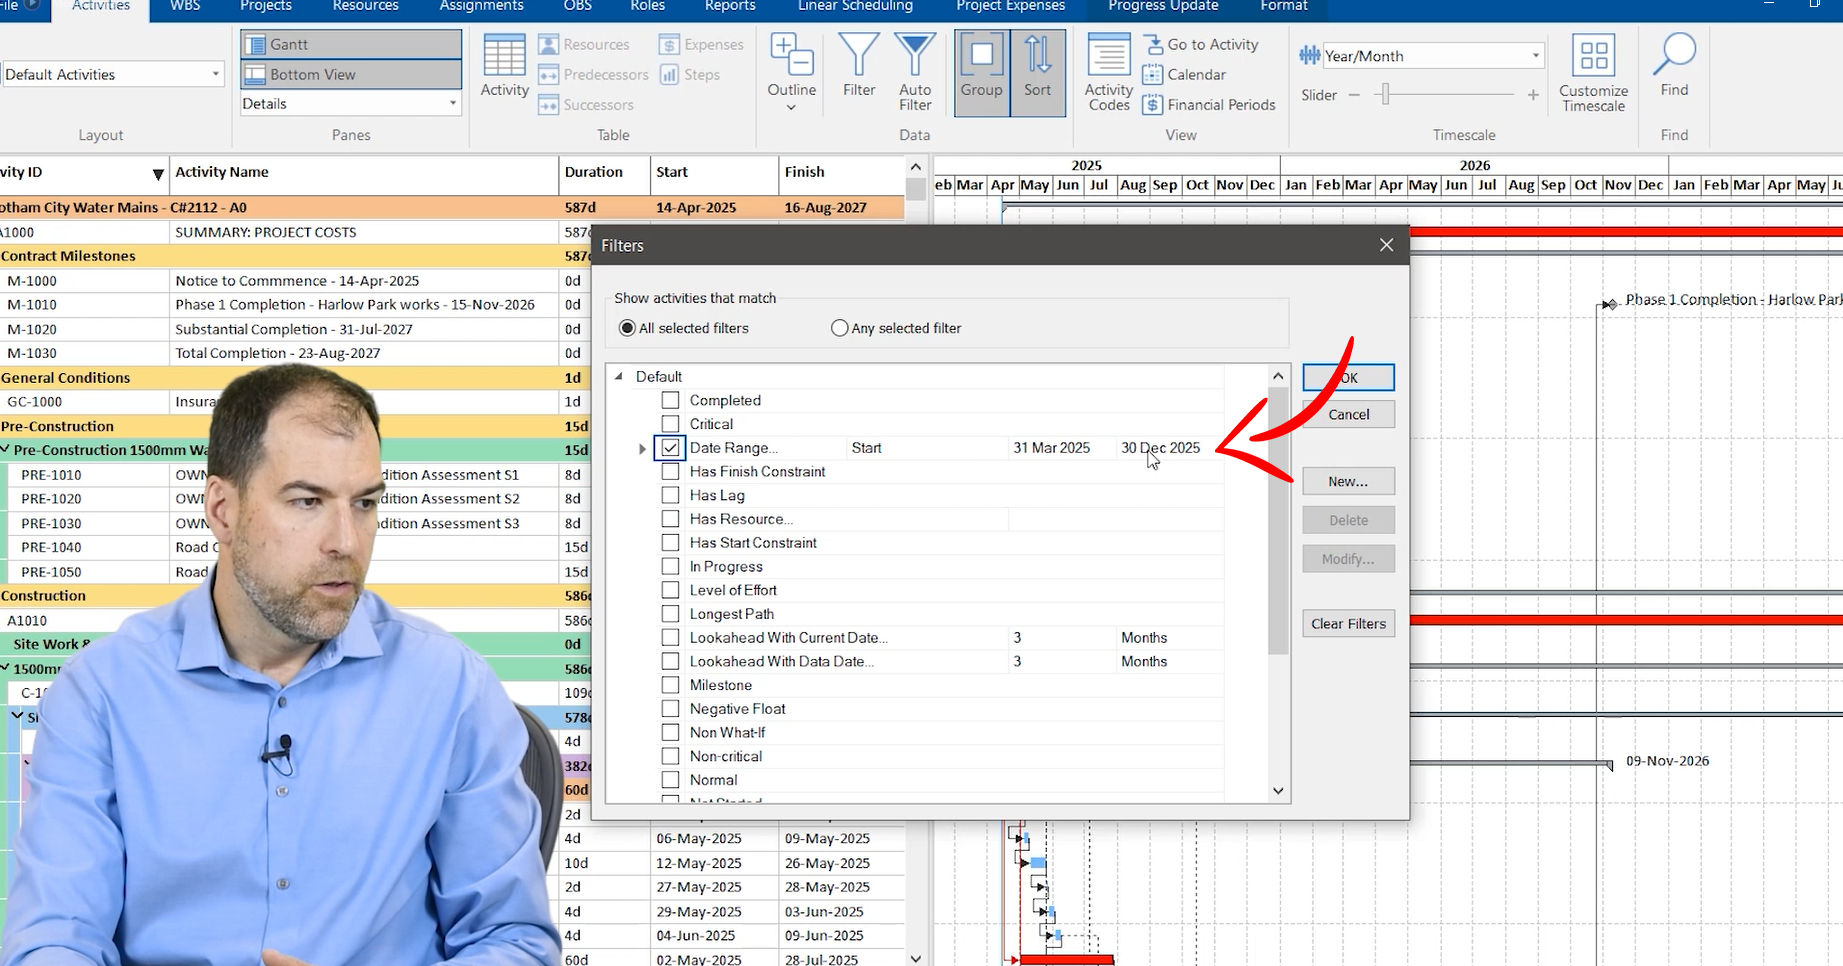
In the image above, a filter was applied with a date range from March 31st and December 2025. This filtering feature allows for a focused view of all the activities and work within that date range. Charts allow you both a detailed down in the weeds view as well as a big picture view of how projects are being sequenced, what the dependencies are between trades, what the milestones are, and what the timing of things are across a year or calendar year or seasons.
In the dynamic worlds of construction and engineering project management, mastering the art of reading Gantt Charts is a valuable skill. These visual tools offer both detailed and big-picture views of project sequences, dependencies, and milestones. By implementing the tips and tricks above, you can enhance your ability to navigate Gantt charts successfully, ultimately contributing to optimized project management and successful project delivery.