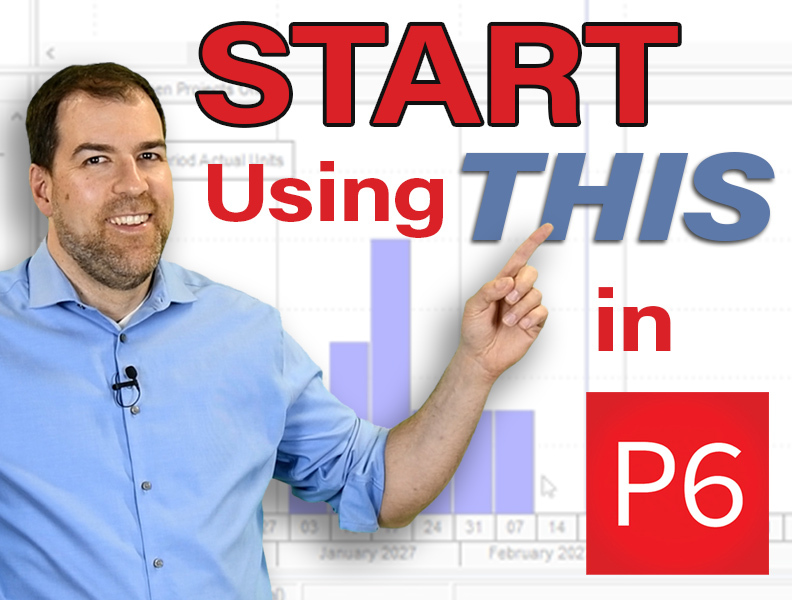
You are probably not using this amazing feature in P6, Stored Period Performance (Financial Periods), right? In this post, I will tell you why you should be using it and what it’s gonna do for you. I’m about to launch my new Advanced P6 Progressing course. And in it, I go deep on Earned Value Management, Financial Periods, and more. But here I’m just gonna give you some important key points to take away.
Stored Period Performance, what is it, what does it do for us? This has to do with how we capture actuals in Primavera P6. We have a problem with how actuals are captured in P6, especially on longer activities. Now, let me give you some visuals on this.
So let’s say I am installing fence, and I wanna install 25 sections of fence. So every week, I’m going to install some portion of that. In the first week, let’s say I do 3 sections. In the next week, let’s say I do 5 sections. Well, if I look at my actuals in P6, P6 will take the total of 3 and 5, equals 8, and spread it out equally over the duration of that activity. Watch what happens in Week 3.
In Week 3, I did 8 sections because I ramped up my productivity. What’s P6 gonna show me? It’s not gonna show me that I did 3 and then 5 and then 8, it’s just gonna say you did 5.3 sections per week, and on, and on, and on. And so by the end of it, I did 25 sections, but it’s just gonna say I did 4.16 sections per week. P6 will not capture the individual weekly updates like that unless you’re using something called Stored Period Performance or Financial Periods is the other language for it.
So what happens with Financial Periods if I wanna look at my graph of productivity, here’s what I’m gonna see, a straight line. I don’t see my increase in productivity or my decrease in productivity. So I can’t garner that information. What we wanna do or what Stored Period Performance does is essentially it takes the actual for the week or for the month, depending on how we wanna configure it, and it locks it in storing it in separate buckets. Let’s it call that. So that I can actually produce this kind of graph.
Now, I’m gonna show you a couple of things, I’m gonna talk about different versions of P6. So let’s flip over to P6. Until recently as of version 20.12, Stored Period Performance had a problem in P6. Like, this feature’s always been there, but nobody used it. And there was a reason.
It’s because these periods that we set, we set the buckets that we wanna capture. In this example we just saw, we set weekly buckets. But some projects might want weekly buckets, other projects want monthly buckets, other projects have also monthly, but they start on Monday instead of Sunday. So there’s all sorts of configuration. And in older versions of P6 before version 20.12, the buckets were global for all projects, meaning I didn’t have the ability to configure different kinds of buckets for all sorts of different situations. I just had one set of buckets. That was a problem.
But in version 20.12, something new came out, and it’s what we call a new type of calendar, which is called the Financial Period Calendar. Where do I find those? Well, you can find them on the Admin menu, right here, Financial Period Calendars.
In the older versions of P6, it’ll just say Financial Periods here. And basically, they’ve created kind of a new type of calendar that allows me to create all these different types of buckets. And then I can apply those to my projects. So here I’ve built some weekly buckets and here’s what that looks like. So 2027, every week, and here are my start and end dates. These are my buckets; I can also create monthly buckets.
For example, monthly buckets look like this. The start and the end date of the bucket is just the start and the end of the month. Then what happens once I create my buckets, my calendar, my Financial Period Calendar, I now can assign it to the project. So here’s my project. And I go to the General tab and down here, there’s a new field called Financial Period Calendar.
This has changed the roadmap for us because now we have the flexibility to use Financial Period Calendars on any project because we can create as many calendars as we want, and we’re not gonna interfere with other people’s calendars. And so what I can do is I can do a project like the one I showed you in my slides where I install 25 fence units over 30 days.
So here we go, I budgeted 25 fence units, my actual say 25. Check this out. If I go and see my productivity, here’s what P6 would’ve shown me, 4.17 every week. Or I can actually now capture the individual weekly updates here using this field, the period actual. So they’re captured.
Not only that, back in the activity screen now, I can do a resource usage profile and I can graph that same productivity chart here. So no longer do I have to see just the flat lines of my actual spread over the duration, I can actually have the buckets and have my progress shown that way. This is a game-changer.
So if you wanna learn more about this, I’ve got a big module on how to use this in my new Advanced P6 Progressing course. Maybe you should check it out. Hope it’s for you. I will see you again soon in another post.