
Primavera P6 Professional version 19.12 was released by Oracle on Dec 23rd of last year. Let me highlight some of the new features, bug fixes and enhancements that you’ll want to know about.
Let’s go!
What’s new in Primavera P6 Professional version 19.12
Watch the video to see what’s new. Read-on for a detailed list of ALL of the enhancements.
Fewer Releases for On-premise Users
Sometime in 2019 Oracle decided to change how often it releases versions for on-premise users.
Up till then, on-premise users had seen 2 updates of Primavera P6 Professional & Primavera P6 EPPM per year; one in the summer and another late in the year.
Now on-premise users will get a single update in December (xx.12).
I was wondering myself what was going on, because we haven’t seen an update since Primavera P6 version 18.8.
Of course, Primavera Cloud users have the priviledge of seeing monthly releases, including important bug fixes and new features.
I don’t necessarily agree with Oracle’s approach here, but it certainly makes a compelling reason to consider their Primavera Cloud offering. I myself use some software subscription services and do appreciate the periodic releases to desktop versions.
This is certainly a trend that will continue and maybe we on-premise users will have to jump on-board at sometime.
Detailed List of Primavera P6 Professional improvements in v19.12
| Useful For | Feature | First Released |
| Admins | Improved Instructions for Adding External Applications to the Tools Menu. The instructions for adding external applications to the tools menu have been updated and improved. | 18.8.2 |
| Cloud Users | Improved Integration with Oracle Prime Projects for Scope and Work Packages. When you are connected to an EPPM database, you can view Scope % Complete, Work Package ID and Work Package Name as columns in the Activities page. The Percent Complete Type for an activity in P6 Professional is Scope when the activity is integrated with Oracle Prime Projects for Scope integration. | 18.8.3 |
| Legacy | Integration With Contract Management Not Supported.Integration between P6 Client and Contract Management is no longer supported. | 18.8.3 |
| Legacy | High Level Planning Has Been Removed.The functionality to allow resource assignments at WBS and Project level to perform high-level resource planning has been removed from P6 Professional. | 18.8.4 |
| New – XML | Check In and Check Out to XML. Checking in and checking out projects uses Primavera XML format. | 19.5 |
| New | Dissolve Activities With Or Without Lag. You can choose whether or not to retain lag when dissolving activities using the Retain lag setting in the Calculations tab of the User Preferences Dialog. If you choose to retain lag, the lag from the dissolved activity's predecessor relationship will be added to that of its successor relationship and applied to the new relationship. | 19.5 |
| Cloud Users | Prime Lean Task Integration With P6 Professional. Imported tasks from the Oracle Prime Projects Tasks app are visible in P6 Professional as tasks assigned to activities in integrated projects. You can see the imported tasks on the Tasks tab in P6 Professional. You can see key data from Oracle Prime Projects about lean tasks in the Tasks detail window in P6 Professional. You can also add columns to your Activities views to see high level information about these tasks. | 19.5 |
| Admins | Control the Export of Project Data. You can use the Export Project Data privilege to allow only certain users to export projects or download data to Excel. | 19.5 |
| FYI | Prime Rebranding. Oracle Prime Projects has been renamed Oracle Primavera Cloud. References to this application have been updated in P6 Professional. | 19.6 |
| Users | Improvements to Stored Images Functionality. Multiple images can be uploaded at the same time. | 19.7 |
| Users | Project Code Maximum Length Changed. The maximum length for Project Codes in PPM databases is 60 characters. | 19.7 |
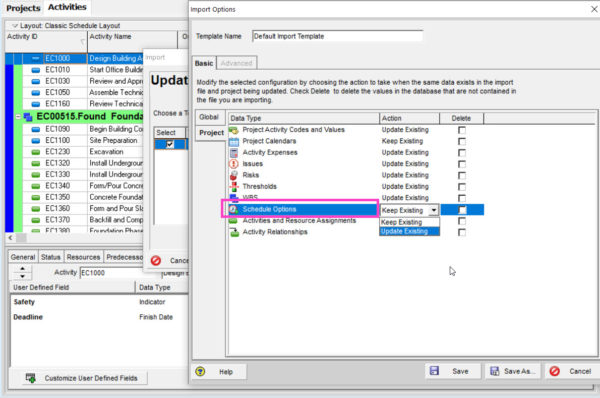
| New – XML | Scheduling and Leveling Options Can Be Exported to and Imported From Primavera XML. When you export projects to Primavera XML format, scheduling and leveling options are included. When importing the Primavera XML file, you can choose whether to import with the Update Existing or Keep Existing import actions against the scheduling and leveling options. | 19.8 |
| Users | Data Date Default for Apply Actuals Changed. The default value for the data date to use when applying actuals has changed. The default is that all projects use their own new data date. | 19.8 |
| New – XML | Improved Currency Import. EPPM Only: You can choose to import projects from Primavera XML files using the currency rate in the XML file or the currency rate in your database. If you import using the currency rate in the XML file, calculations convert the values to account for differences in the exchange rates in the XML file and your database. To use the currency rate in the XML file, you must have a matching currency ID and name in your database. | 19.8 |
| New – XML | Update Baselines When Importing Primavera XML Files. EPPM Only: You can choose to update baselines when importing a project from a Primavera XML file. When you select the Update Existing import action at the project level, matching baselines you import will be updated from the import file. Baselines you choose to import but which do not have a match in your database against the project you selected to update will be added to the project. | 19.8 |
| Admins | Allow or Restrict Access to Resources From Multiple Parent Resources. You can select up to five resources when defining which resources a user can access. The user can access and use the selected resources and all child resources of the selected resources. | 19.9 |
| New – XML | Update Baselines When Importing Primavera XML Files. Standalone and PPMDB: You can choose to update baselines when importing a project from a Primavera XML file. When you select the Update Existing import action at the project level, matching baselines you import will be updated from the import file. Baselines you choose to import but which do not have a match in your database against the project you selected to update will be added to the project. | 19.9 |
| Users | User Preferences Are Saved When You Close the User Preferences Dialog Box. Any changes you make in the User Preferences dialog box are saved when you close the dialog box. | 19.10 |
| New – XML | Choose to Export Primavera XML Files Into a Compressed File. When you export projects in Primavera XML format you can choose to have the files exported to a single compressed file in .zip format. | 19.10 |
| Legacy | Internet Explorer 11 is deprecated. Microsoft Internet Explorer 11 is supported in this release, but might not be supported in a future release. | 19.10 |
| Cloud Users | See the Proposed Due Date from Oracle Primavera Cloud in P6 Professional. EPPM Only: The Proposed Due Date field from Oracle Primavera Cloud can be sent to and received from P6 Professional via Primavera Gateway. | 19.11 |
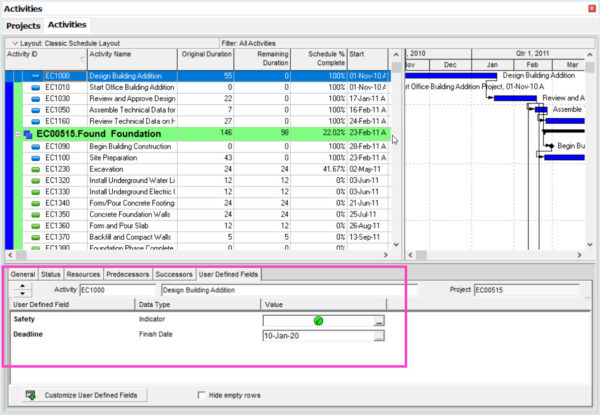
| New | View User Defined Fields in a Detail Tab. A detail tab showing User Defined Fields (UDFs) is available in the following pages: Projects, Activities, WBS, Project Expenses, Resource Assignments, Issues, and Work Products and Documents. For PPM installations, the UDF detail tab is also available in the Risks page. | 19.11 |
| Cloud Users | Oracle Primavera Cloud Quantitative Risk Analysis Data is Available on the Activities and EPS Pages. EPPM Only: In the Activities page, you can see which activities were part of the critical path during risk analysis in Oracle Primavera Cloud and how often those activities were on the path in the Pre-Response Criticality Index and Post-Response Criticality Index columns. In the EPS page, you can view the Pre-Response Pessimistic Start Date, Pre-Response Pessimistic Finish Date, Post-Response Pessimistic Start Date, and Post-Response Pessimistic Finish Date fields calculated in Oracle Primavera Cloud during quantitative risk analysis. | 19.12 |
| EPPM | Project Preference Can Prevent Primary Resources from Updating Activity Dates in a Timesheet. EPPM Only: The Allow primary resources to update activity dates option allows project managers control over when and how primary resources can update the start and finish dates of the activities in a project. | 19.12 |
| EPPM | Enable Publication When Copying Projects. When you copy and paste projects, you can select to switch on the Enable Publication option for the pasted copies of the projects. | 19.12 |
| EPPM | Allow Multiple Users to Access a Portfolio. When you create a portfolio, you can choose to allow selected users to access the portfolio. You can also make existing portfolios available to multiple users and copy and paste portfolios in the portfolio list. | 19.12 |
My Opinion on Primavera P6 v19.12
While I’ve been waiting since Aug of 2018 for an update which seems like a long while, I’m happy to see quite a few improvements to Primavera P6 Professional in v19.12.
There’s a lot of focus on data movement, especially around P6’s XML file format, and it’s been a long time coming.
We can now update Baselines when importing XML projects. We can import Zipped XML files. We have better currency support in XML. We can export Primavera P6’s Scheduling options in XML now – this feature alone might force users to opt for XML over XER files.
Perhaps the XER file is on it’s way out. It’s looking that way.
We always have to guess whether Primavera P6 Professional will become a dead product as far as Oracle is concerned, but with some nice features added here, perhaps we’re going to be pleasantly surprised that Primavera P6 will continue to live on desktops for many more years.
What do YOU think? Drop me a line in the comments.