
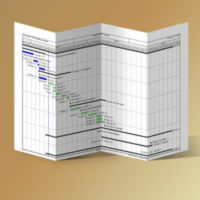
Have you ever printed your P6 Gantt Chart only to find that you can’t quite see the first or last milestone because they fall off the page or are cutoff? I have.
Here’s how to avoid printing a scrunched gantt chart by easily expanding your P6 gantt timescale before you print.
Very Well Explained…
Dear Michael….. Can u please spare some time to explain few queries I have encountered:
1- After resource loading and viewing Resource Usage Profile in the bottom Layout, we go to print preview and can see S Curve along with Histograms. Is it possible to have histogram values shown on top of Histograms.
2- In above scenario can we show Percentage of Cum Budg. Units on Right Side Vertical Scale instead of Cum Budg Units.
3- Similarly we go to Tracking and after adjusting proper Fields and setting, in Print Preview we can see S Curve and Histograms but unable to view Spread Sheet Values as set in Bottom Layout. again Histogram Values are not shown on top of histograms…
Thanks in advance!!
Regrads,
Sajid
Hi Sajid,
I see your problems. The graphing features in P6 are somewhat limited, especially when trying to add info to graphs for printing. I don’t have a solution for any of your questions above, other than to export your data to excel and graph it in excel. As P6 experts, we also become excel experts too.
Best of luck,
Michael
Well explained Michael. I cannot tell you how many times I have had to read a schedule where all activities or some of them were partially cropped off the page.
Really enjoyed this video. I plan to share with with my readers on twitter this week.
@thehaironfirepm
Thanks Roshan! We look forward to seeing your tweets.
Dear Gentlemen,
usually as Mr. Michael said I use his method for printout, but some time your layout could not fit in your A4 size and the chart spit into many sheets, so I choose (A3) size for paper layout and convert it to .pdf and then later on I open this file and print it as (A4) size and it’s really works.
If am wrong please inform me.
Thanks and best regards,
Is there a way to print a moving Gantt.
In other terms can i have the durations for gantt chart as per activity shown on that specific page ?
Lets say I have a 10 year schedule and i do not want to print the gantt chart for all these 10 years on every sheet.
Use page breaks for each year. You can do this in the setup.
Dear Michael,
Firstly, many thanks for the helpful video, a great tip, which makes the work look neat. But unfortunately, I am stuck on a major issue here on P6 Gantt chart, my Gantt Chart is not viewable at full scale (as in all of the gantt chart is not showing on print preview, and only half of it,) e.g. its only showing until 2014 4th quarter (in all four pages displayed) whereas, project finishes in the 2nd quarter of 2016! so why is other half of gantt chart not viewable, on print view? Waiting for your response, your assistance would be a great gift for P6 beginner like me.
Many thanks
Ayesha
Hi Ayesha,
Have you got your dates properly set on the Page Setup – Options tab?
Timescale Start should be PS-2w and Timescale Finish should be PF+2w.
Are you sure the latest activity in the project in fact is scheduled in Q2 2016?
Michael
can u plz explain me the base line concept….
i didnot under stand it…
regards,
abubakar
thank you very much for the video demonstrations. its very usefull. thanks