Put plainly, project status reports are difficult to write. It is a fact that project managers in different industries can come together and agree upon. But while it can be difficult to put together a document that has the right tone for the audience, has the pertinent information discussed at the appropriate depth, and can be functional rather than just informational, project managers are tasked
Primavera P6 Reporting tutorials
Check our top Primavera P6 tutorials on reporting in Primavera P6 Professional.
Here’s A Quick Way To Keep Your Primavera P6 Milestones in Focus
26 CommentsPrimavera P6 Milestone Activities in any schedule usually represent the most important deadlines, deliveries, start ups or drop-dead dates for a project. These are undeniably dates that you’ll want to stay on top of and keep close at hand in case you’re asked for a report or to check on the health of the project. But it can be difficult to search for milestones in a large construction schedule,
Bad P6 Progressing: Analysis With Deltek Acumen Fuse
Leave a CommentIn this post, we're talking about bad P6 progressing. That's right. Bad P6 progressing. I'm about to launch a brand-new course called "Advanced P6 Progressing". In this new course, I show you how to progress all sorts of different ways, earn value, financial periods, and much more. But one of the things that we really dive deep into is bad P6 progressing - what you should not do when you progress
How to Show the Critical Path in P6
41 CommentsNot sure how to show the Critical Path in Primavera P6? Not sure if your project's critical activities might be hiding? Don't worry. Here are 4 easy ways you can laser-in on your project's Critical Path in P6 (including 3 reasons you might not have one). 4 Easy Ways to Show the Critical Path in Primavera P6 1. Check the Gantt Chart By default, the P6 Gantt chart will show your project's
Quickly Export From Primavera P6 To Excel
10 Comments
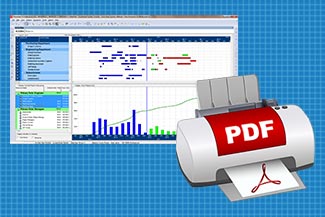
Faster is better. That should be Oracle Primavera's mantra. Well, in this case it is! Exporting Primavera P6 data to Excel could not be faster & easier with this quick tip. Getting Primavera P6 Activity data into Excel is essential. Excel's data crunching, grouping, pivoting and filtering is just so much easier to use than Primavera P6's. Even generating S-curves and graphs is better in
5 Things ScheduleReader Does That Primavera P6 Can’t
4 CommentsI've been a fan of PrimaveraReader (or now ScheduleReader) for a quite a while. SchedulerReader is a truly great XER file viewer that fills many gaps for organizations using Primavera P6 Professional planning & scheduling software. More on that in a second. Last month, PrimaveraReader underwent a complete rebrand that had it move away from referencing the name "Primavera". Not surprisingly,
How to Audit Your Primavera P6 Global Activity Codes
13 CommentsI had a very simple question posed to me in the Plan Academy Member's Community area recently about auditing P6's Activity Codes. It was this: How can I prepare a report to see which projects use my Global Activity Codes? ie: Can I prepare a report where I can see all the “Global Activity Codes” used in each project in my Primavera P6 database? Posted by one our P6 trainees, it was a question
Boring Project Reports? 11 Project Timeline Tools To Help You Create Visual Reports
14 CommentsLet's face it, our attention spans are short. And they are getting shorter. All the content we digest from the internet is developed to capture our attention and hold it for as long a possible, but we all know that something shinier or sexier will show up any second now. When it comes to conveying important project information to stakeholders, clients or colleagues, we have to take the same
How To Find Relationship Lag in Primavera P6
59 CommentsIt's not very easy to find Relationship Lag in Primavera P6 project schedules. There aren't really any features to highlight which relationships have lag or lead time. But understanding how leads or lags are used on your Primavera P6 project is a vital part of analyzing a project schedule. We need a process to find relationship lag in Primavera P6 schedule. And I'm going to show you
How To Create a Predecessors Report in Primavera P6
30 CommentsOn most construction projects Primavera P6 schedules are presented to stakeholders in PDF file format due to the obvious formatting advantage that PDF offers. Unfortunately, when reviewing a P6 Gantt Chart printed to PDF, there is very little information available about the logic relationships between activities in the schedule. In this tutorial I'll shod you the steps to follow to create an
How To Print To PDF in Primavera P6 Professional
27 CommentsPrimavera P6 Professional is no doubt a great tool for managing large-scale construction and engineering projects. One of P6's crowning glories is that it can handle huge schedules ( up to 100,000 Activities) with ease. Yes, working with loads of project data works great, but many find that getting the data in and out is not always a piece of cake. Printing to a printer is mostly easy enough
Compare XER Files With Change Inspector
19 CommentsWhat's the easy way to compare XER files? Are you an owner or client who uses Primavera P6 but has to review a schedule that is constantly being updated from a 3rd party? When receiving an updated schedule, a few common questions might include: What actuals data was changed since the last update? Were any activities added or deleted and how do I find them? Were there any other
Project Metrics vs KPIs – Knowing The Difference
5 CommentsI had a manager once, back in my IT days, who suddenly insisted, "If I get another 12-page project report, I'm tossing it." It was too much data to process, so I paired my report down to a 1-page project dashboard that highlighted KPIs for all of my projects. He loved it. And it soon became a template that was adopted throughout the office. That was 12 years ago. But today, we're all still
How to Print a Calendar from Primavera P6, with some help
17 Comments
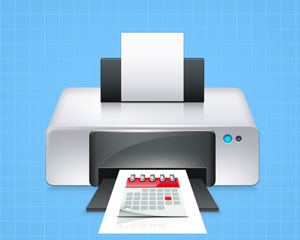
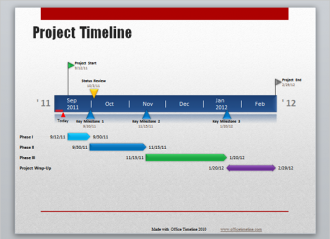
In this quick tutorial we show how to create a 12-month formatted calendar in Excel based on the data extracted from an xer file using the handy Xer-Reader utility. Hopefully I will soon provide a more technical explanation on how the code works in the xer reader wiki. Michael has written excellent article about calendars and The Biggest Problem with Primavera P6 Calendars, And How You Can
What in the World is an S-Curve? [In under 100 words]
14 CommentsAn S-curve is a graph of the expenditure of project resources over time. Typical S-curves graph either costs or resource hours over time. The S-curve graphs the cummulative value of expenditures on the y-axis, giving the graph it's S shape. S-curves will often graph planned values, with the actual curve overlayed for comparison. The real benefit of the S-curve is that it shows the total
Critical Path vs Longest Path
37 CommentsWhen it comes to your project's Critical Path, there are few topics more important to your client. The expectation is that YOU, dear scheduler, are the expert. So YOU had better know your project's Critical Path inside and out. But wait! ......Is it the Critical Path you should be reporting on, or the Longest Path? The terms Critical Path and Longest Path are often used interchangeably when
Graphing a P6 Resource S-Curve in Excel
6 CommentsIn my previous tutorial in this series, I described the procedure to export resource assignment data from P6 to Excel. Most of us have worked with Excel charts in our job or during our study in college or university. What we all know is that they are really helpful when you want to demonstrate some analytical information without technical terms. In this tutorial, I am going to tell you how to
What is Primavera P6 Visualizer?
13 CommentsThe new version of Primavera P6, r8.3, has been released recently, and one of the new features is a stand-alone software, called the Primavera P6 Visualizer. This software provides you with a visual, read-only version of the plans you’ve stored in the P6 database. The Primavera P6 Visualizer is a good choice for those team members who are not supposed to change anything in plans, but need to
Create a P6 Project Dashboard in Excel
29 CommentsTutorial Files Excel Spreadsheet (Excel 2007+): PTuts_Project_Dashboard.xlsm - 1.5Mb One of our previous site manager told us (the project control team), that if we bring to him another report that have more than 1 page, he will just throw it away (sic), actually managers care only about the big picture, and don’t bother reviewing every small details. The purpose of this tutorial is to
Quick Tip: Mixing AND and OR Options in Primavera P6 Filters
10 CommentsBuilding a filter where all the conditions are either 'And' or ‘Or’ between each row is pretty straightforward. However, if you want to mix them up a little its not so obvious how you should do that in Oracle Primavera P6 Professional. This quick tip will show you how. Example: I want to find all the milestones in the project that have a date variance that is not equal to zero. In other words,
The Essential Guide to Printing Layouts in Primavera P6
40 CommentsPrimavera P6 provides the ability to display project schedule information using “Layouts”. Layouts are customizable views of project information and are the primary method for printing Gantt Charts, Profiles, Spreadsheets, and Trace Logic views. Schedules are tough to read and all members of the project team can benefit from an easier way to interpret their schedules. Did you know that you can
Quick Tip: Descrunch the P6 Gantt Timescale For Better Printing
11 CommentsHave you ever printed your P6 Gantt Chart only to find that you can't quite see the first or last milestone because they fall off the page or are cutoff? I have. Here's how to avoid printing a scrunched gantt chart by easily expanding your P6 gantt timescale before you print.
[Video] Building a Stacked Histogram in Primavera P6
37 CommentsA great way to see all your resource assignment levels comparatively over time is to use a Stacked Histogram in Primavera P6. It's a feature that is available in the Resource Usage Profile charting facility. The process to get this all working is a bit convoluted, so we're going to show you step-by-step the process. Stacked Histograms are common sight in project environments.
Primavera P6 Relationship Lines Point to Baseline Bars. Why? [Video]
8 CommentsPrimavera P6 relationships lines sometimes do some strange things. By now you've probably figured out how to turn on and off the relationships lines on the Primavera P6 Gantt Chart using the toggle button on the toolbar. But do you do if Primavera P6's relationship lines are pointing to the baseline bars? Well, in P6 order is important! Last post, we showed you the nuances of shading
How to Build a Lookahead Filter in Primavera P6
74 CommentsA lookahead filter in Primavera P6 provides us with the ability to create lookahead reports. Lookahead reports are one of the centerpieces of consistent project reporting and controlling. Lookahead reports filter and highlight upcoming activities in the project. Most common lookahead reports focus on activities scheduled for the upcoming week, next 2 weeks, next 3 weeks, next month and next 3
Using Primavera P6 Filters On Export To Excel
19 CommentsPrimavera's custom Activity filters are great for focusing in on a subcontractor's work list or even to hide Activities that are already completed. But when it comes to filtering down a 5000 line project plan to Activities in a specific timeframe, P6's filters fall flat. Here's the Gotcha: any filter that uses a rolling date or P6's built-in date variables will not work when exporting P6 data to